Bar Graph (Double) - Average of Series (Level 3)
This math topic focuses on advanced data analysis and graph interpretation skills, specifically through double bar graphs. The problems involve calculating the average of various data series. Examples given include determining the average rainfall for certain cities during specific months, and calculating the daily average production of pizzas at different establishments. Each question provides visual data via double bar graphs, requiring the reader to analyze, interpret the graphs, and apply arithmetic operations to find the average values.
Work on practice problems directly here, or download the printable pdf worksheet to practice offline.
moreGraphing - Bar Graph (Double) - Average of Series Worksheet
| Math worksheet on 'Graphing - Bar Graph (Double) - Average of Series (Level 3)'. Part of a broader unit on 'Data and Graphs (Mins, Max, Averages) - Practice' Learn online: app.mobius.academy/math/units/data_graphing_sums_and_averages_practice/ |
1

| What is the average number of pizzas produced each day at Jane's? |
a
| 100 |
b
| 20 |
c
| 40 |
d
| 70 |
e
| 80 |
f
| 30 |
2

| What is the average number of pizzas produced each day at Jane's? |
a
| 50 |
b
| 20 |
c
| 40 |
d
| 70 |
e
| 60 |
f
| 0 |
3
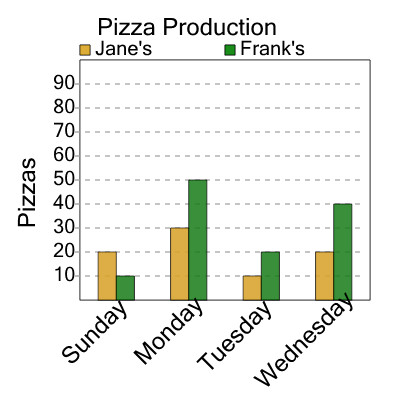
| What is the average number of pizzas produced each day at Frank's? |
a
| 30 |
b
| 20 |
c
| 0 |
d
| 60 |
e
| 90 |
4
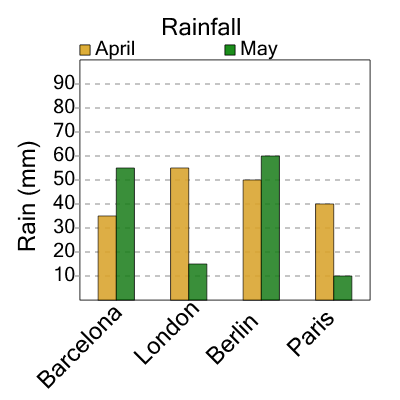
| What is the average amount of rain that falls during April in these cities? |
a
| 50 |
b
| 45 |
c
| 75 |
d
| 40 |
e
| 5 |
f
| 70 |
5

| What is the average amount of rain that falls during April in these cities? |
a
| 30 |
b
| 10 |
c
| 5 |
d
| 40 |
e
| 60 |
6

| What is the average number of pizzas produced each day at Jane's? |
a
| 85 |
b
| 65 |
c
| 35 |
d
| 45 |
e
| 105 |
7
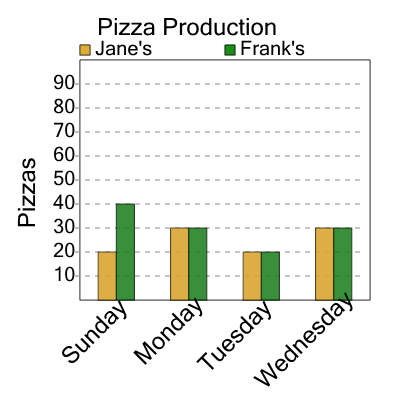
| What is the average number of pizzas produced each day at Frank's? |
a
| 30 |
b
| 0 |
c
| 70 |
d
| 80 |
e
| 40 |