Bar Graph (Double) - Difference at Point (Level 1)
This math topic focuses on advanced data interpretation and graph analysis skills, specifically using double bar graphs. The problems involve comparing quantities represented on the graphs and determining the difference between two data points, such as "How many more boys than girls have hamsters?" or "How many more girls than boys have dogs?" Each question is set in a practical context that requires students to analyze the bar graphs to find the answer, enhancing their ability to interpret and draw conclusions from visual data.
Work on practice problems directly here, or download the printable pdf worksheet to practice offline.
moreGraphing - Bar Graph (Double) - Difference at Point Worksheet
| Math worksheet on 'Graphing - Bar Graph (Double) - Difference at Point (Level 1)'. Part of a broader unit on 'Data and Graphs (Mins, Max, Averages) - Practice' Learn online: app.mobius.academy/math/units/data_graphing_sums_and_averages_practice/ |
1

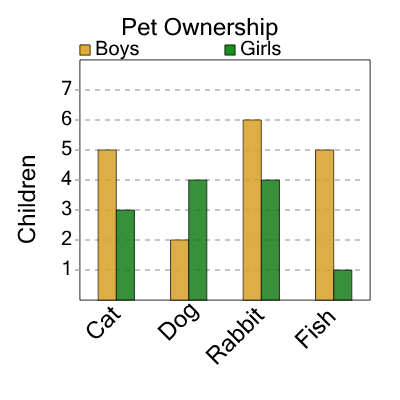
| How many more boys than girls have fishs? |
a
| 5 |
b
| 6 |
c
| 2 |
d
| 1 |
e
| 3 |
f
| 7 |
2
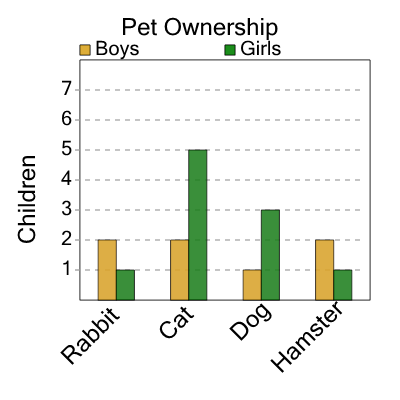
| How many more girls than boys have hamsters? |
a
| 3 |
b
| 0 |
c
| 1 |
d
| 6 |
e
| 2 |
f
| 8 |
3

| How many more boys than girls have cats? |
a
| 2 |
b
| 8 |
c
| 9 |
d
| 3 |
e
| 5 |
f
| 4 |
4
| How many more girls than boys have dogs? |
a
| 9 |
b
| 2 |
c
| 4 |
d
| 0 |
e
| 6 |
f
| 3 |
5
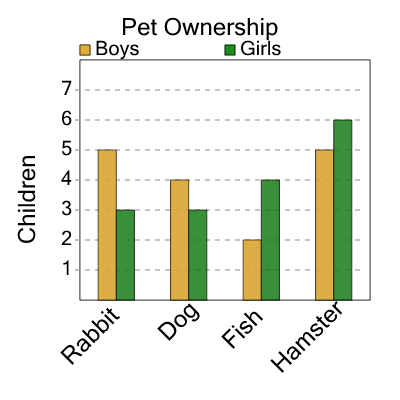
| How many more girls than boys have fishs? |
a
| 5 |
b
| 3 |
c
| 2 |
d
| 8 |
e
| 1 |
f
| 4 |
6

| How many more girls than boys have cats? |
a
| 8 |
b
| 5 |
c
| 1 |
d
| 0 |
e
| 3 |
f
| 2 |
7

| How many more boys than girls have fishs? |
a
| 2 |
b
| 3 |
c
| 5 |
d
| 4 |
e
| 8 |