Bar Graph (Double) - Difference of Two (Level 2)
This math topic focuses on analyzing double bar graphs to solve problems involving comparisons. Students are required to determine the difference in preferences between two groups (e.g., boys and girls) for various sports. The task involves interpreting bar graphs to answer questions about the numerical difference in sport preferences, which aids in developing skills in reading and analyzing graphical data. Each question provides a set of multiple-choice answers, enhancing students' abilities to deduce information from visual data representations and apply it to specific questions.
Work on practice problems directly here, or download the printable pdf worksheet to practice offline.
moreGraphing - Bar Graph (Double) - Difference of Two Worksheet
| Math worksheet on 'Graphing - Bar Graph (Double) - Difference of Two (Level 2)'. Part of a broader unit on 'Data and Graphs - Advanced' Learn online: app.mobius.academy/math/units/data_graphing_advanced/ |
1

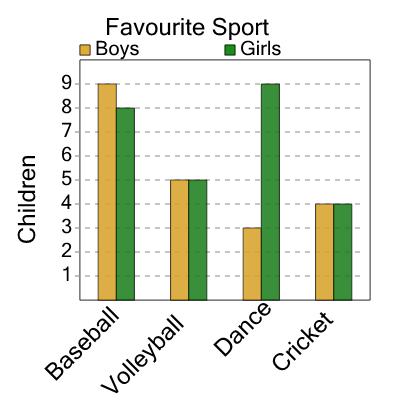
| How many more girls like soccer than boys like swimming as a sport? |
a
| 5 |
b
| 6 |
c
| 1 |
d
| 8 |
e
| 4 |
f
| 2 |
2

| How many more boys like gymnastics than girls like soccer as a sport? |
a
| 2 |
b
| 3 |
c
| 9 |
d
| 5 |
e
| 7 |
f
| 1 |
3

| How many more boys like football than girls like gymnastics as a sport? |
a
| 3 |
b
| 10 |
c
| 0 |
d
| 6 |
e
| 1 |
f
| 9 |
4
| How many more boys like baseball than girls like volleyball as a sport? |
a
| 1 |
b
| 2 |
c
| 4 |
d
| 8 |
e
| 7 |
f
| 9 |
5

| How many more girls like football than boys like soccer as a sport? |
a
| 4 |
b
| 10 |
c
| 1 |
d
| 6 |
e
| 3 |
f
| 0 |
6
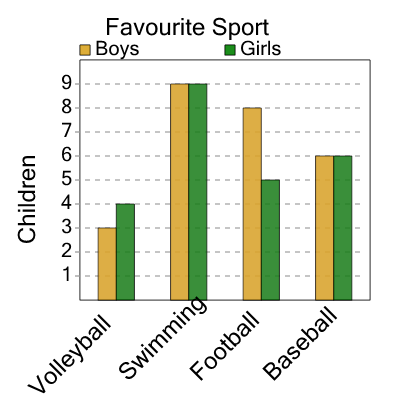
| How many more boys like football than girls like volleyball as a sport? |
a
| 3 |
b
| 2 |
c
| 4 |
d
| 1 |
e
| 11 |
7

| How many more boys like football than girls like volleyball as a sport? |
a
| 3 |
b
| 2 |
c
| 9 |
d
| 1 |
e
| 4 |