Bar Graph (Double) - Difference of Two (Level 3)
This math topic focuses on interpreting and analyzing double bar graphs to solve problems involving comparison. The tasks are centered on finding the difference in measurements (like millimeters of rain or quantities of pizzas) between two different datasets represented on each graph. It includes comparisons across different cities and times, and one instance of comparing quantities of pizzas produced on different days. This topic helps enhance skills in data interpretation and calculating differences using visual data aids.
Work on practice problems directly here, or download the printable pdf worksheet to practice offline.
moreGraphing - Bar Graph (Double) - Difference of Two Worksheet
| Math worksheet on 'Graphing - Bar Graph (Double) - Difference of Two (Level 3)'. Part of a broader unit on 'Data and Graphs (Mins, Max, Averages) - Intro' Learn online: app.mobius.academy/math/units/data_graphing_sums_and_averages_intro/ |
1

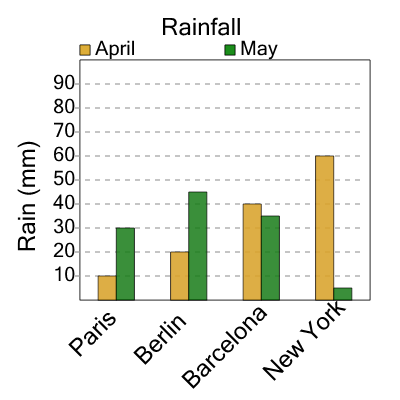
| How many more millimeters of rain were there during April in London than during May in Paris? |
a
| 75 |
b
| 60 |
c
| 55 |
d
| 25 |
e
| 50 |
f
| 10 |
2
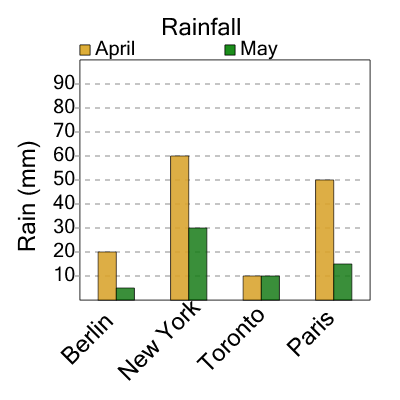
| How many more millimeters of rain were there during April in New York than during May in Berlin? |
a
| 55 |
b
| 25 |
c
| 75 |
d
| 20 |
e
| 65 |
f
| 50 |
3

| How many more pizzas were made on Thursday at Frank's than on Tuesday at Jane's? |
a
| 20 |
b
| 0 |
c
| 40 |
d
| 60 |
e
| 80 |
f
| 30 |
4
| How many more millimeters of rain were there during April in New York than during May in Paris? |
a
| 35 |
b
| 30 |
c
| 20 |
d
| 0 |
e
| 15 |
f
| 65 |
5

| How many more pizzas were made on Thursday at Frank's than on Tuesday at Jane's? |
a
| 80 |
b
| 20 |
c
| 40 |
d
| 70 |
e
| 30 |
f
| 50 |
6

| How many more pizzas were made on Tuesday at Jane's than on Monday at Frank's? |
a
| 50 |
b
| 20 |
c
| 70 |
d
| 30 |
e
| 80 |
f
| 10 |
7
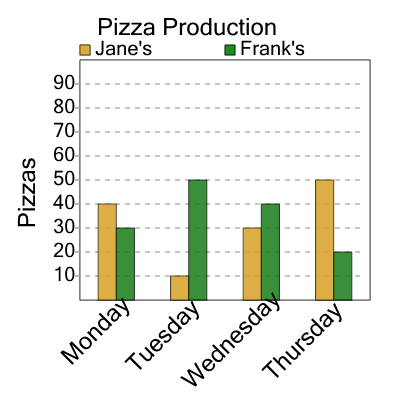
| How many more pizzas were made on Thursday at Jane's than on Wednesday at Frank's? |
a
| 20 |
b
| 70 |
c
| 10 |
d
| 60 |
e
| 30 |
f
| 50 |