Bar Graph (Double) - Maximum of Series (Level 3)
This math topic focuses on interpreting double bar graphs to determine maximum data points in various scenarios. The exercises involve analyzing graphs to identify cities with the highest rainfall for specific months, and days with peak pizza production at different locations. The problems enhance skills in reading and comparing data displayed on bar graphs, fostering better decision-making based on graphical representations.
Work on practice problems directly here, or download the printable pdf worksheet to practice offline.
moreGraphing - Bar Graph (Double) - Maximum of Series Worksheet
| Math worksheet on 'Graphing - Bar Graph (Double) - Maximum of Series (Level 3)'. Part of a broader unit on 'Data and Graphs - Advanced' Learn online: app.mobius.academy/math/units/data_graphing_advanced/ |
1
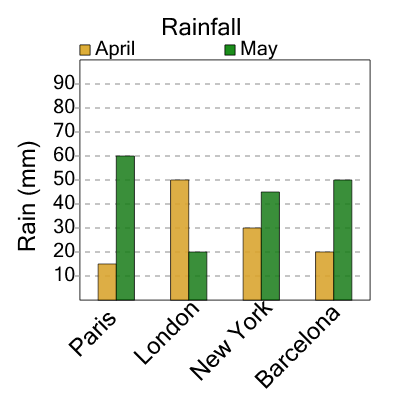
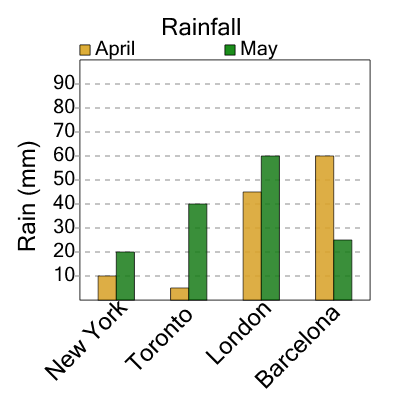
| What city had the LARGEST amount of rain in May? |
a
| Paris |
b
| Barcelona |
c
| London |
d
| New York |
2
| What city had the LARGEST amount of rain in April? |
a
| New York |
b
| Toronto |
c
| Barcelona |
d
| London |
3
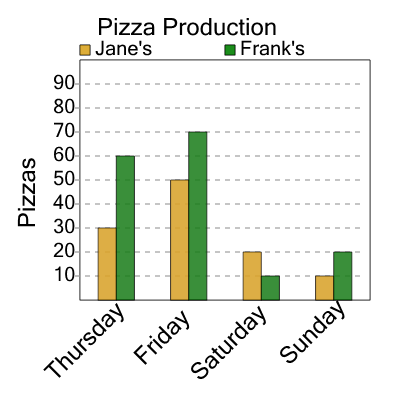
| On what day were the MOST pizzas made at Frank's? |
a
| Thursday |
b
| Friday |
c
| Saturday |
d
| Sunday |
4
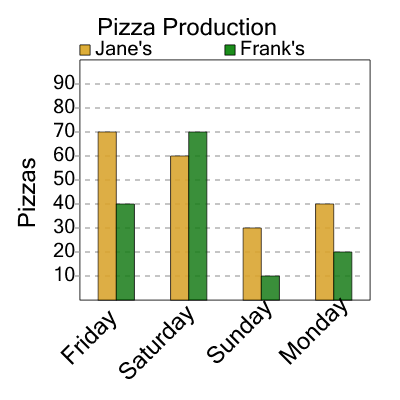
| On what day were the MOST pizzas made at Frank's? |
a
| Sunday |
b
| Monday |
c
| Saturday |
5
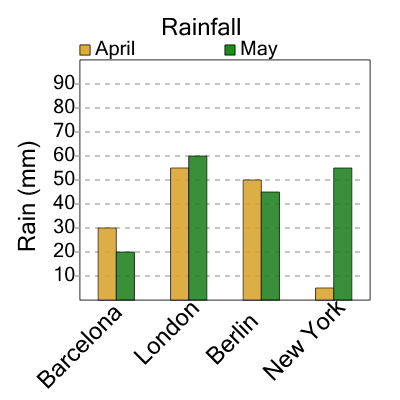
| What city had the LARGEST amount of rain in May? |
a
| London |
b
| Berlin |
c
| Barcelona |
d
| New York |
6
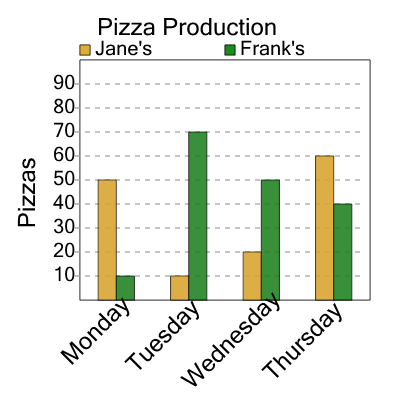
| On what day were the MOST pizzas made at Frank's? |
a
| Monday |
b
| Wednesday |
c
| Tuesday |
d
| Thursday |
7
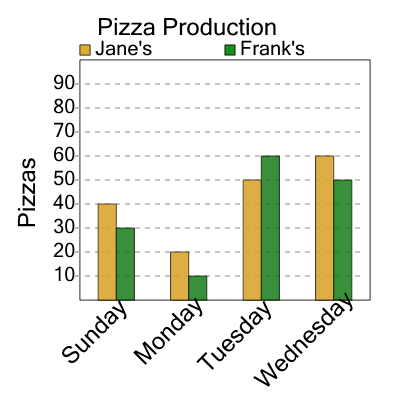
| On what day were the MOST pizzas made at Jane's? |
a
| Wednesday |
b
| Sunday |
c
| Monday |
d
| Tuesday |