Bar Graph (Double) - Maximum at Point (Level 1)
This math topic focuses on interpreting double bar graphs to determine which of two groups, boys or girls, has a greater count of different pets (like hamsters, cats, rabbits, and fish) at a specific point. It requires students to analyze and compare data visually using advanced graphs part of a broader unit on Data and Graphs. The problems ask direct questions based on the graphs, helping students enhance their skills in reading and understanding complex graphical data.
Work on practice problems directly here, or download the printable pdf worksheet to practice offline.
moreGraphing - Bar Graph (Double) - Maximum at Point Worksheet
| Math worksheet on 'Graphing - Bar Graph (Double) - Maximum at Point (Level 1)'. Part of a broader unit on 'Data and Graphs (Mins, Max, Averages) - Practice' Learn online: app.mobius.academy/math/units/data_graphing_sums_and_averages_practice/ |
1
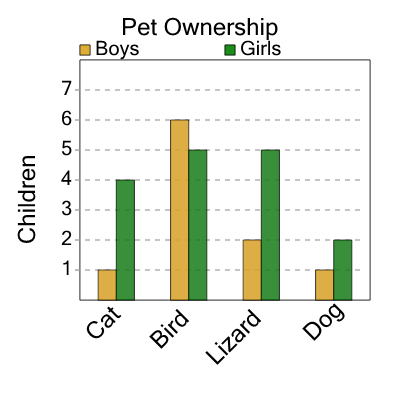
| Do boys or girls have more birds? |
a
| Boys |
b
| Girls |
2
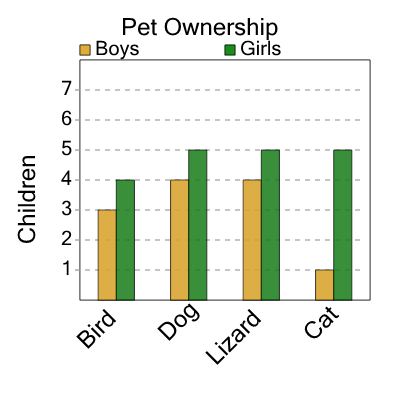
| Do boys or girls have more lizards? |
a
| Boys |
b
| Girls |
3

| Do boys or girls have more dogs? |
a
| Boys |
b
| Girls |
4

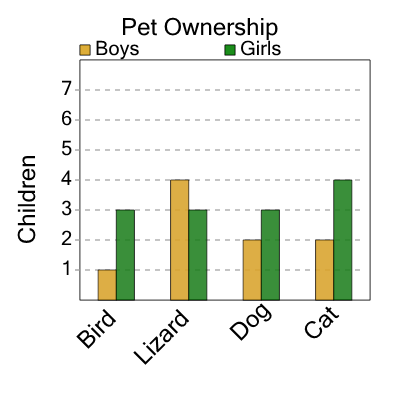
| Do boys or girls have more lizards? |
a
| Boys |
b
| Girls |
5

| Do boys or girls have more birds? |
a
| Girls |
b
| Boys |
6
| Do boys or girls have more lizards? |
a
| Boys |
b
| Girls |
7

| Do boys or girls have more birds? |
a
| Girls |
b
| Boys |