Bar Graph (Double) - Minimum Overall (Level 1)
This math topic focuses on interpreting double bar graphs to identify which pets are least favored among boys and girls. Each question presents a different double bar graph and asks students to analyze the data and determine for which pet either boys or girls show the lowest preference. The students are given multiple-choice answers to select their response. This exercise enhances skills in data interpretation, comparative analysis, and understanding graphical representations in a real-world context involving categorical data.
Work on practice problems directly here, or download the printable pdf worksheet to practice offline.
moreGraphing - Bar Graph (Double) - Minimum Overall Worksheet
| Math worksheet on 'Graphing - Bar Graph (Double) - Minimum Overall (Level 1)'. Part of a broader unit on 'Data and Graphs - Practice' Learn online: app.mobius.academy/math/units/data_graphing_practice/ |
1

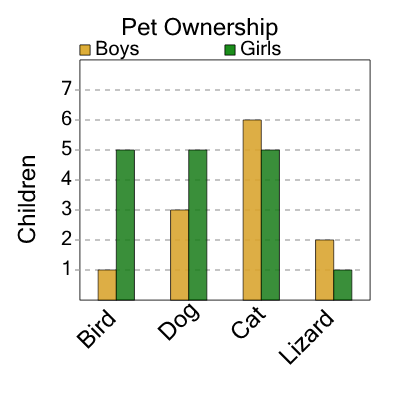
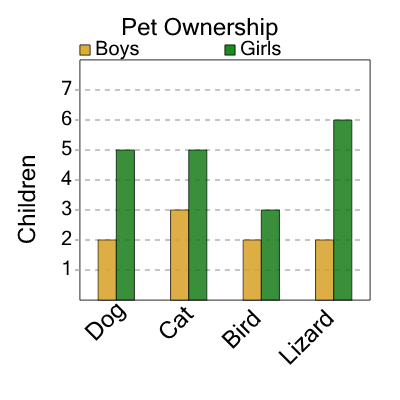
| What pet do the SMALLEST number of either boys or girls have? |
a
| Girls / Fish |
b
| Girls / Cat |
c
| Boys / Bird |
d
| Girls / Lizard |
2
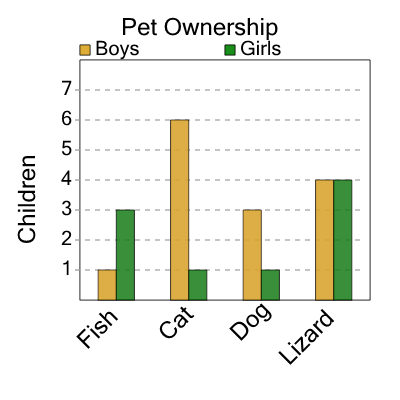
| What pet do the SMALLEST number of either boys or girls have? |
a
| Girls / Dog |
b
| Boys / Bird |
c
| Boys / Lizard |
3

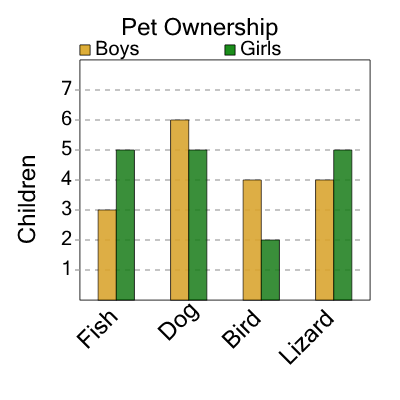
| What pet do the SMALLEST number of either boys or girls have? |
a
| Boys / Bird |
b
| Girls / Dog |
c
| Boys / Fish |
d
| Girls / Cat |
4
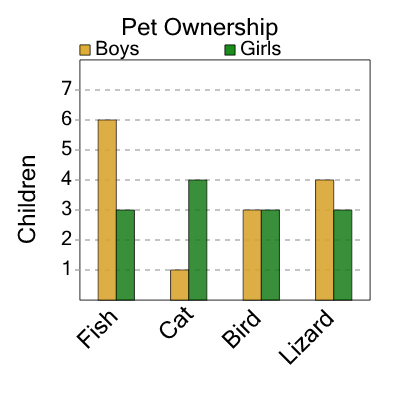
| What pet do the SMALLEST number of either boys or girls have? |
a
| Boys / Fish |
b
| Boys / Cat |
c
| Boys / Lizard |
5
| What pet do the SMALLEST number of either boys or girls have? |
a
| Boys / Lizard |
b
| Girls / Fish |
c
| Girls / Bird |
d
| Boys / Dog |
6
| What pet do the SMALLEST number of either boys or girls have? |
a
| Girls / Bird |
b
| Boys / Fish |
c
| Boys / Cat |
7
| What pet do the SMALLEST number of either boys or girls have? |
a
| Boys / Cat |
b
| Girls / Bird |
c
| Boys / Lizard |
d
| Boys / Dog |