Bar Graph (Double) - Minimum at Point (Level 2)
This math topic focuses on interpreting double bar graphs. Learners practice identifying which of two groups (boys or girls) has a lesser value for a certain activity, such as volleyball, gymnastics, cricket, baseball, swimming, and dance. This involves analyzing bar heights and comparing quantities visually and contextually to determine the minimum value at a given point. These problems are designed to enhance skills in reading and understanding advanced data presented in graphical format within a real-world context of sports and activities preferences by gender.
Work on practice problems directly here, or download the printable pdf worksheet to practice offline.
moreGraphing - Bar Graph (Double) - Minimum at Point Worksheet
| Math worksheet on 'Graphing - Bar Graph (Double) - Minimum at Point (Level 2)'. Part of a broader unit on 'Data and Graphs (Mins, Max, Averages) - Practice' Learn online: app.mobius.academy/math/units/data_graphing_sums_and_averages_practice/ |
1
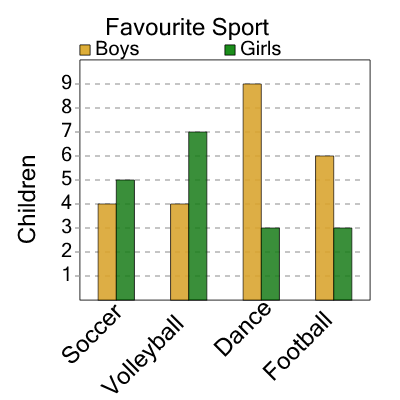
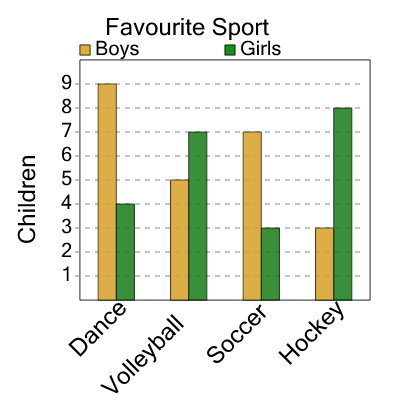
| Do fewer boys or girls like dance? |
a
| Boys |
b
| Girls |
2
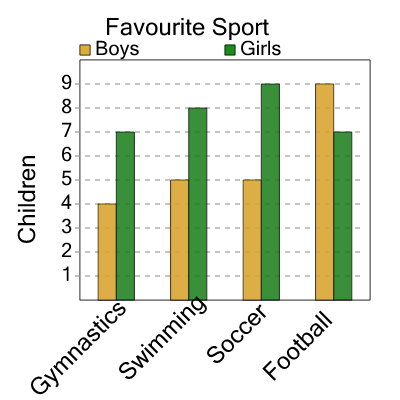
| Do fewer boys or girls like soccer? |
a
| Girls |
b
| Boys |
3
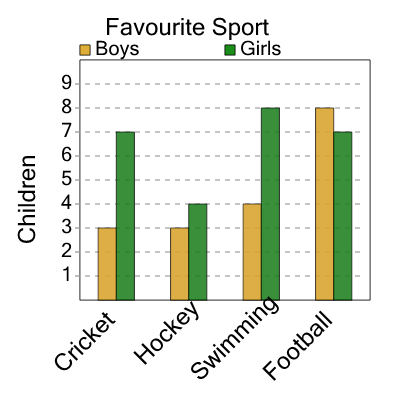
| Do fewer boys or girls like swimming? |
a
| Girls |
b
| Boys |
4
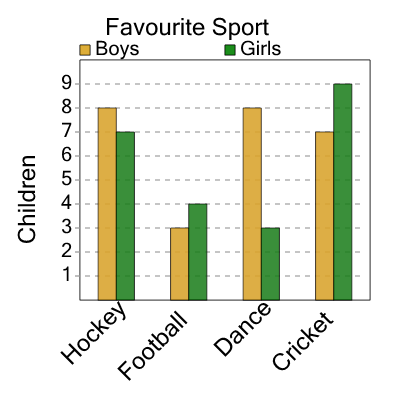
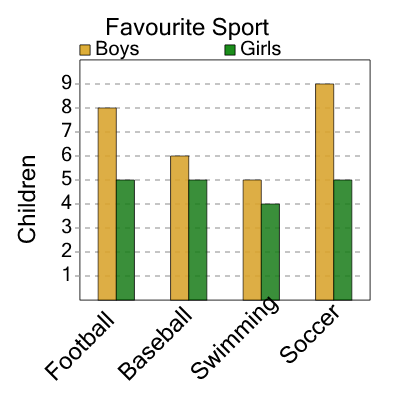
| Do fewer boys or girls like football? |
a
| Girls |
b
| Boys |
5
| Do fewer boys or girls like swimming? |
a
| Boys |
b
| Girls |
6
| Do fewer boys or girls like soccer? |
a
| Girls |
b
| Boys |
7
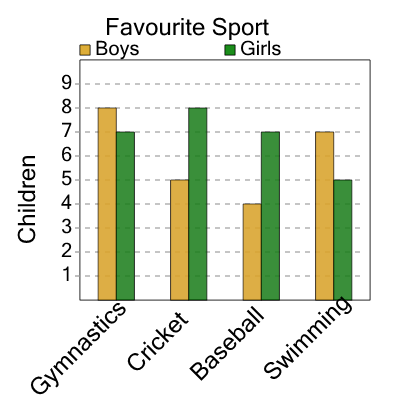
| Do fewer boys or girls like gymnastics? |
a
| Boys |
b
| Girls |