Bar Graph (Double) - Read Category (Level 3)
This math topic focuses on interpreting double bar graphs. It includes extracting specific data based on the category and values represented on the graph. The problems involve identifying rainfall amounts for different cities across varying months and determining the number of pizzas made on specific days at a particular location. Each question requires reading data from the bar graph to answer questions about either the total rainfall in millimeters for specified cities during particular months, or the quantity of pizzas produced on certain days.
Work on practice problems directly here, or download the printable pdf worksheet to practice offline.
moreGraphing - Bar Graph (Double) - Read Category Worksheet
| Math worksheet on 'Graphing - Bar Graph (Double) - Read Category (Level 3)'. Part of a broader unit on 'Data and Graphs - Advanced' Learn online: app.mobius.academy/math/units/data_graphing_advanced/ |
1
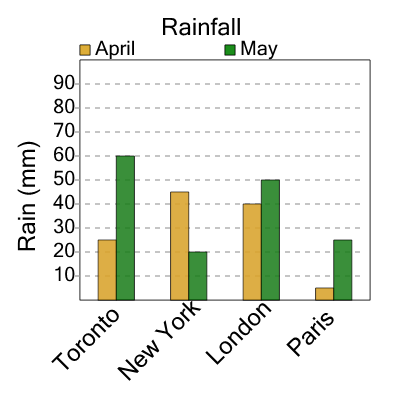
| What city had 20 millimeters of rain in May? |
a
| New York |
b
| Toronto |
c
| London |
d
| Paris |
2

| What city had 5 millimeters of rain in April? |
a
| Toronto |
b
| London |
c
| Paris |
d
| Berlin |
3

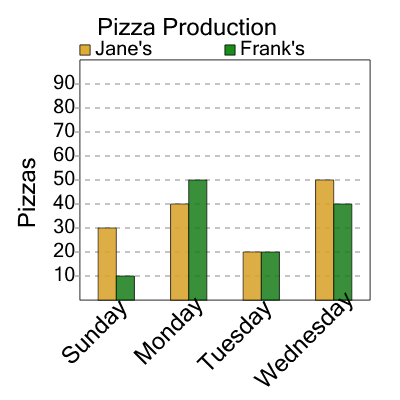
| On what day were 10 pizzas made at Frank's? |
a
| Saturday |
b
| Sunday |
c
| Monday |
4

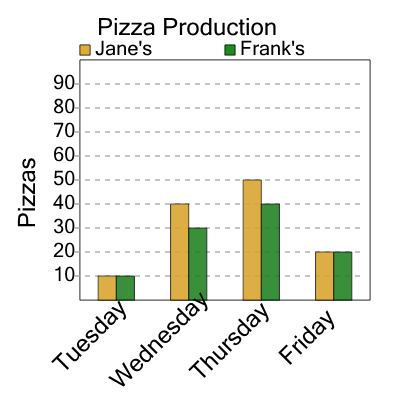
| On what day were 10 pizzas made at Frank's? |
a
| Wednesday |
b
| Thursday |
c
| Friday |
d
| Saturday |
5
| On what day were 10 pizzas made at Frank's? |
a
| Wednesday |
b
| Tuesday |
c
| Sunday |
6
| On what day were 10 pizzas made at Frank's? |
a
| Tuesday |
b
| Thursday |
c
| Wednesday |
7
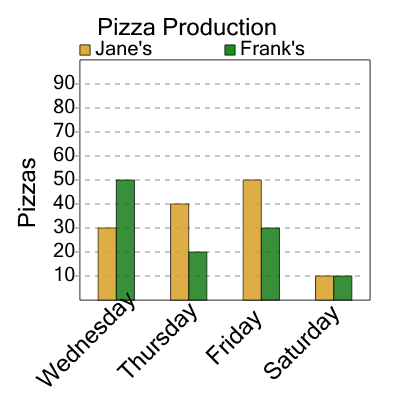
| On what day were 40 pizzas made at Jane's? |
a
| Saturday |
b
| Friday |
c
| Thursday |