Bar Graph (Double) - Read Value (Level 2)
This math topic focuses on interpreting double bar graphs. Students are asked to practice reading values from dual-axis bar graphs, each comparing data points between boys and girls regarding their preferences for different sports. The problems require identifying specific values, such as the number of boys or girls who favor sports like volleyball, dance, swimming, football, cricket, and soccer. Each question is associated with a graph and multiple-choice answers, enhancing skills in data interpretation and comparison.
Work on practice problems directly here, or download the printable pdf worksheet to practice offline.
moreGraphing - Bar Graph (Double) - Read Value Worksheet
| Math worksheet on 'Graphing - Bar Graph (Double) - Read Value (Level 2)'. Part of a broader unit on 'Data and Graphs - Practice' Learn online: app.mobius.academy/math/units/data_graphing_practice/ |
1

| How many boys like hockey as a sport? |
a
| 1 |
b
| 8 |
c
| 3 |
d
| 5 |
e
| 12 |
2
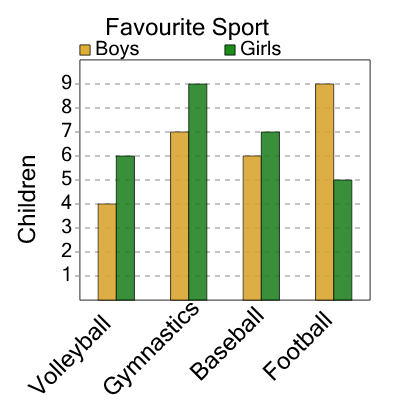
| How many girls like gymnastics as a sport? |
a
| 2 |
b
| 9 |
c
| 1 |
d
| 13 |
e
| 14 |
f
| 15 |
3
| How many boys like volleyball as a sport? |
a
| 12 |
b
| 1 |
c
| 6 |
d
| 8 |
e
| 13 |
f
| 7 |
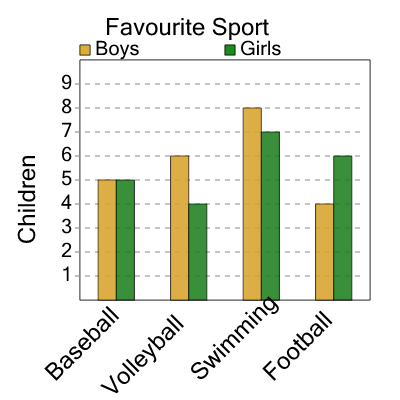
4
| How many girls like swimming as a sport? |
a
| 2 |
b
| 9 |
c
| 16 |
d
| 3 |
e
| 11 |
f
| 13 |
5

| How many boys like volleyball as a sport? |
a
| 11 |
b
| 6 |
c
| 13 |
d
| 9 |
e
| 12 |
f
| 2 |
6

| How many girls like hockey as a sport? |
a
| 8 |
b
| 4 |
c
| 3 |
d
| 2 |
e
| 12 |
f
| 5 |
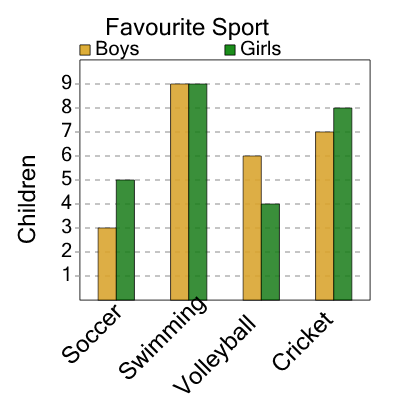
7

| How many boys like volleyball as a sport? |
a
| 2 |
b
| 13 |
c
| 4 |
d
| 6 |
e
| 7 |
f
| 0 |