Bar Graph (Double) - Sum of Two (Level 3)
This math topic focuses on advanced data interpretation and graphical analysis using double bar graphs. The problems involve calculating combined values from the presented bar graphs related to real-life contexts like rainfall measurements in different cities and pizza production on specific days at different locations. The exercises require the learner to sum up values for selected pairs across various bar graphs, enhancing their ability to interpret complex data visually and perform arithmetic operations based on that data.
Work on practice problems directly here, or download the printable pdf worksheet to practice offline.
moreGraphing - Bar Graph (Double) - Sum of Two Worksheet
| Math worksheet on 'Graphing - Bar Graph (Double) - Sum of Two (Level 3)'. Part of a broader unit on 'Data and Graphs (Mins, Max, Averages) - Intro' Learn online: app.mobius.academy/math/units/data_graphing_sums_and_averages_intro/ |
1
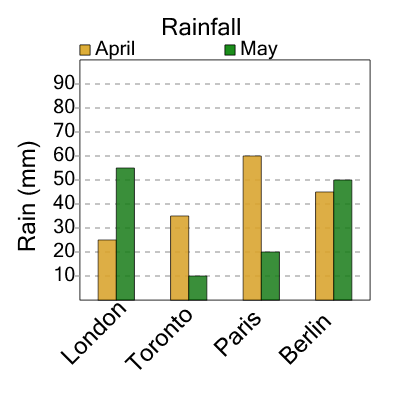
| How many millimeters of rain were there during April in London and Berlin total? |
a
| 55 |
b
| 105 |
c
| 70 |
d
| 80 |
e
| 90 |
f
| 95 |
2
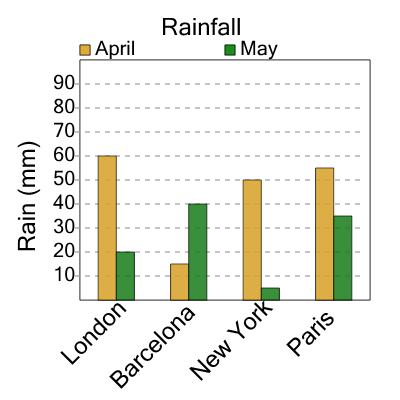
| How many millimeters of rain were there during April in Paris and New York total? |
a
| 95 |
b
| 85 |
c
| 105 |
d
| 125 |
e
| 90 |
f
| 130 |
3
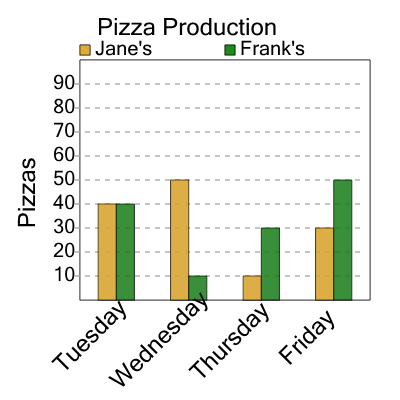
| How many pizzas were made at Frank's on Tuesday and Wednesday combined? |
a
| 0 |
b
| 30 |
c
| 100 |
d
| 50 |
e
| 70 |
f
| 20 |
4
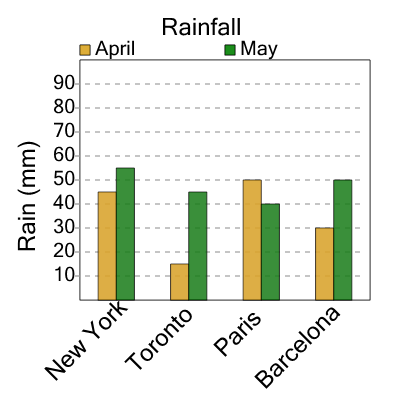
| How many millimeters of rain were there during April in Paris and Toronto total? |
a
| 45 |
b
| 85 |
c
| 90 |
d
| 100 |
e
| 65 |
f
| 80 |
5

| How many millimeters of rain were there during April in Paris and New York total? |
a
| 95 |
b
| 60 |
c
| 35 |
d
| 75 |
e
| 20 |
f
| 90 |
6

| How many millimeters of rain were there during May in Barcelona and London total? |
a
| 30 |
b
| 85 |
c
| 65 |
d
| 75 |
e
| 25 |
f
| 80 |
7

| How many pizzas were made at Jane's on Friday and Sunday combined? |
a
| 100 |
b
| 130 |
c
| 70 |
d
| 20 |
e
| 50 |