Bar Graph (Double) - Total at Point (Level 3)
This math topic focuses on interpreting double bar graphs to find total values at specific points. Skills practiced include analyzing data presented in bar graphs, calculating total amounts, comparing different data sets, and applying these skills to practical scenarios such as total rainfall in cities and the total number of pizzas made on specific days. The problems encourage understanding and interpreting advanced data representations.
Work on practice problems directly here, or download the printable pdf worksheet to practice offline.
moreGraphing - Bar Graph (Double) - Total at Point Worksheet
| Math worksheet on 'Graphing - Bar Graph (Double) - Total at Point (Level 3)'. Part of a broader unit on 'Data and Graphs (Mins, Max, Averages) - Practice' Learn online: app.mobius.academy/math/units/data_graphing_sums_and_averages_practice/ |
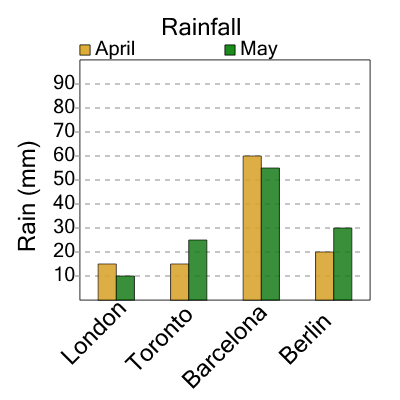
1
| How much total rain was there in london? |
a
| 80 |
b
| 105 |
c
| 65 |
d
| 130 |
e
| 125 |
2
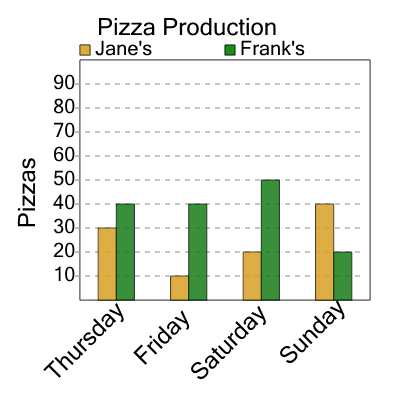
| How many pizzas in total were made on friday? |
a
| 70 |
b
| 50 |
c
| 80 |
d
| 10 |
e
| 120 |
f
| 20 |
3

| How many pizzas in total were made on thursday? |
a
| 60 |
b
| 0 |
c
| 40 |
d
| 110 |
e
| 80 |
f
| 130 |
4
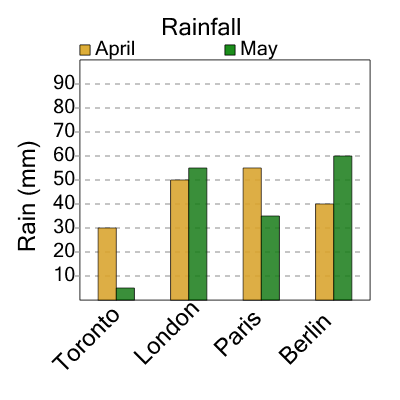
| How much total rain was there in berlin? |
a
| 65 |
b
| 50 |
c
| 75 |
d
| 15 |
e
| 35 |
f
| 85 |
5

| How many pizzas in total were made on friday? |
a
| 80 |
b
| 40 |
c
| 60 |
d
| 20 |
e
| 10 |
f
| 110 |
6

| How much total rain was there in paris? |
a
| 125 |
b
| 115 |
c
| 145 |
d
| 90 |
e
| 95 |
f
| 85 |
7

| How many pizzas in total were made on tuesday? |
a
| 110 |
b
| 30 |
c
| 80 |
d
| 10 |
e
| 50 |
f
| 20 |