Bar Graph (Single) - Difference of Two (Level 1)
This math topic focuses on analyzing single bar graphs to determine the difference in quantities represented on the graph. The problems specifically ask students to find how many more kids have one type of pet compared to another, fostering skills in data interpretation and basic arithmetic operations such as subtraction. The various questions cover comparisons between different types of pets, asking students to refer to visual data. This topic is part of a broader unit on data and graphs.
Work on practice problems directly here, or download the printable pdf worksheet to practice offline.
moreGraphing - Bar Graph (Single) - Difference of Two Worksheet
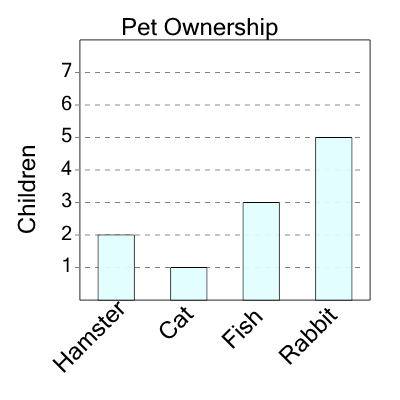
| Math worksheet on 'Graphing - Bar Graph (Single) - Difference of Two (Level 1)'. Part of a broader unit on 'Data and Graphs - Intro' Learn online: app.mobius.academy/math/units/data_graphing_intro/ |
1
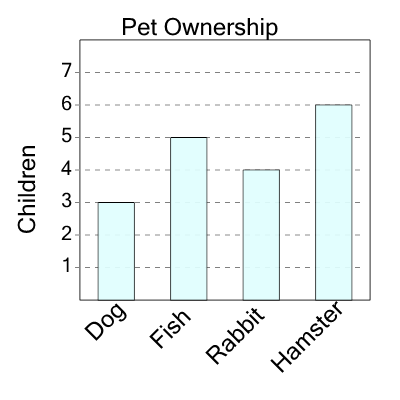
| How many more kids have a fish than a dog as a pet? |
a
| 6 |
b
| 2 |
c
| 4 |
d
| 0 |
e
| 3 |
f
| 7 |
2
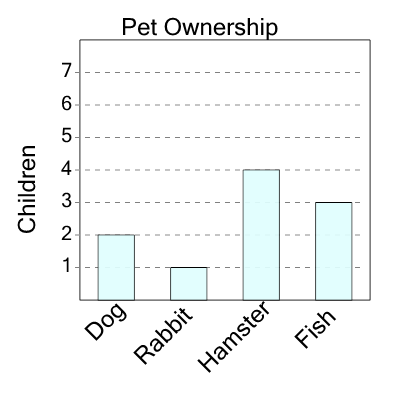
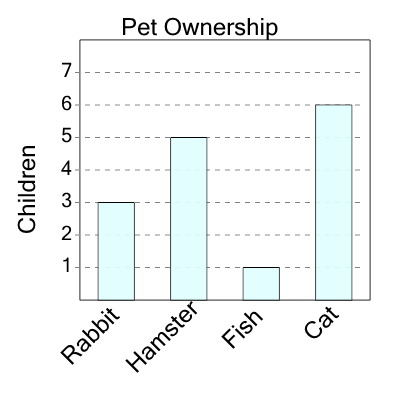
| How many more kids have a hamster than a rabbit as a pet? |
a
| 6 |
b
| 3 |
c
| 5 |
d
| 1 |
e
| 8 |
f
| 9 |
3
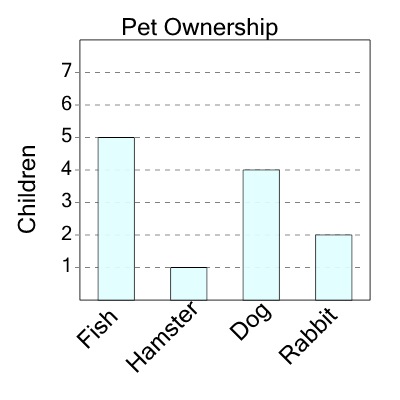
| How many more kids have a fish than a rabbit as a pet? |
a
| 3 |
b
| 4 |
c
| 9 |
d
| 8 |
e
| 5 |
f
| 1 |
4
| How many more kids have a rabbit than a fish as a pet? |
a
| 3 |
b
| 9 |
c
| 4 |
d
| 10 |
e
| 1 |
f
| 2 |
5
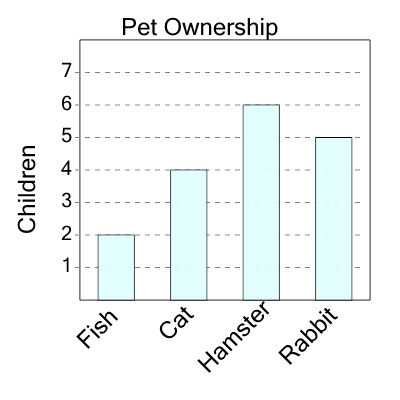
| How many more kids have a fish than a cat as a pet? |
a
| 4 |
b
| 2 |
c
| 0 |
d
| 5 |
e
| 3 |
f
| 6 |
6
| How many more kids have a cat than a fish as a pet? |
a
| 6 |
b
| 3 |
c
| 1 |
d
| 10 |
e
| 0 |
f
| 5 |
7
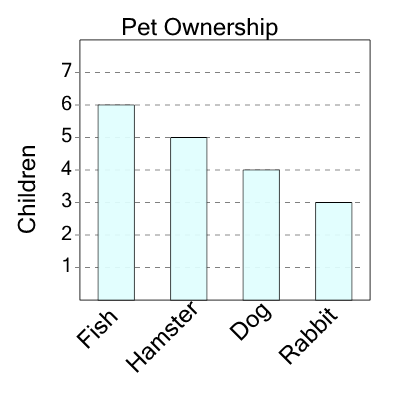
| How many more kids have a fish than a dog as a pet? |
a
| 2 |
b
| 3 |
c
| 6 |
d
| 1 |