Bar Graph (Single) - Maximum (Level 2)
This math topic focuses on interpreting single-series bar graphs to determine the maximum data point in various contexts. Students are tasked with identifying which sport the largest number of children prefer the most, based on the bar graph presented in each question. Each activity is designed to improve the student's ability to read, analyze, and draw conclusions from visual data representations, in this case, bar graphs. Each question provides multiple-choice answers, aiding in learning how to extract specific information and enhance graphical literacy.
Work on practice problems directly here, or download the printable pdf worksheet to practice offline.
moreGraphing - Bar Graph (Single) - Maximum Worksheet
| Math worksheet on 'Graphing - Bar Graph (Single) - Maximum (Level 2)'. Part of a broader unit on 'Data and Graphs - Intro' Learn online: app.mobius.academy/math/units/data_graphing_intro/ |
1

| What sport do the largest number of children like most? |
a
| Gymnastics |
b
| Swimming |
c
| Hockey |
2

| What sport do the largest number of children like most? |
a
| Swimming |
b
| Baseball |
c
| Football |
3

| What sport do the largest number of children like most? |
a
| Volleyball |
b
| Soccer |
c
| Gymnastics |
d
| Football |
4

| What sport do the largest number of children like most? |
a
| Dance |
b
| Hockey |
c
| Football |
d
| Volleyball |
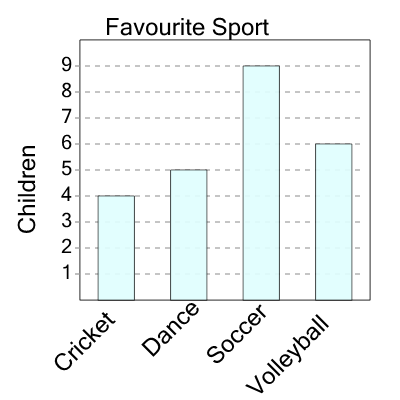
5

| What sport do the largest number of children like most? |
a
| Dance |
b
| Cricket |
c
| Soccer |
d
| Swimming |
6
| What sport do the largest number of children like most? |
a
| Cricket |
b
| Volleyball |
c
| Dance |
d
| Soccer |
7

| What sport do the largest number of children like most? |
a
| Cricket |
b
| Dance |
c
| Baseball |