Bar Graph (Single) - Read Value (Level 2)
This math topic focuses on interpreting single bar graphs. Each problem presents a bar graph related to how many kids prefer various sports like gymnastics, cricket, baseball, dance, swimming, and soccer. Students must read the supplied bar graphs to determine the number of kids who favor each sport. Multiple-choice answers are provided for students to select from, emphasizing the ability to accurately read and interpret data from the graphs. This is part of an introductory unit on data and graphs.
Work on practice problems directly here, or download the printable pdf worksheet to practice offline.
moreGraphing - Bar Graph (Single) - Read Value Worksheet
| Math worksheet on 'Graphing - Bar Graph (Single) - Read Value (Level 2)'. Part of a broader unit on 'Data and Graphs - Intro' Learn online: app.mobius.academy/math/units/data_graphing_intro/ |
1

| How many kids like football as a sport? |
a
| 4 |
b
| 2 |
c
| 8 |
d
| 3 |
e
| 6 |
2

| How many kids like gymnastics as a sport? |
a
| 1 |
b
| 4 |
c
| 7 |
d
| 3 |
e
| 8 |
3
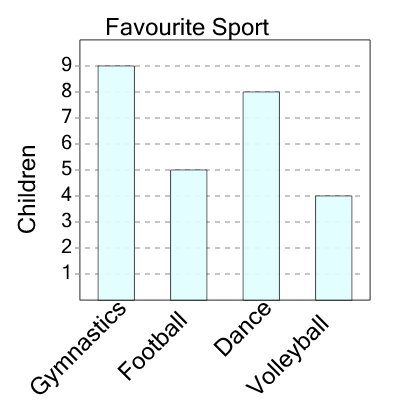
| How many kids like volleyball as a sport? |
a
| 8 |
b
| 5 |
c
| 0 |
d
| 1 |
e
| 3 |
f
| 4 |
4

| How many kids like soccer as a sport? |
a
| 0 |
b
| 1 |
c
| 4 |
d
| 11 |
e
| 6 |
f
| 7 |
5
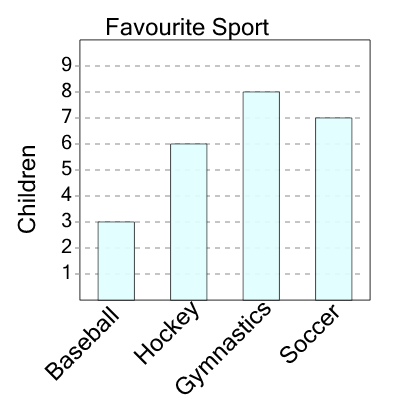
| How many kids like hockey as a sport? |
a
| 13 |
b
| 2 |
c
| 4 |
d
| 8 |
e
| 6 |
f
| 10 |
6

| How many kids like baseball as a sport? |
a
| 12 |
b
| 11 |
c
| 2 |
d
| 5 |
e
| 1 |
f
| 0 |
7

| How many kids like baseball as a sport? |
a
| 5 |
b
| 8 |
c
| 1 |
d
| 10 |
e
| 13 |
f
| 7 |