Bar Graph (Single) - Sum of Two (Level 1)
This math topic focuses on interpreting single bar graphs to find the sum of data points for specific categories. It assesses the ability to identify the number of children having one kind of pet or another (such as a dog, fish, rabbit, or hamster) by analyzing visual data represented in bar graphs. Each question presents a different scenario requiring users to sum quantities from the graph, aiding in the development of skills in data interpretation and addition based on graphical information.
Work on practice problems directly here, or download the printable pdf worksheet to practice offline.
moreGraphing - Bar Graph (Single) - Sum of Two Worksheet
| Math worksheet on 'Graphing - Bar Graph (Single) - Sum of Two (Level 1)'. Part of a broader unit on 'Data and Graphs - Intro' Learn online: app.mobius.academy/math/units/data_graphing_intro/ |
1
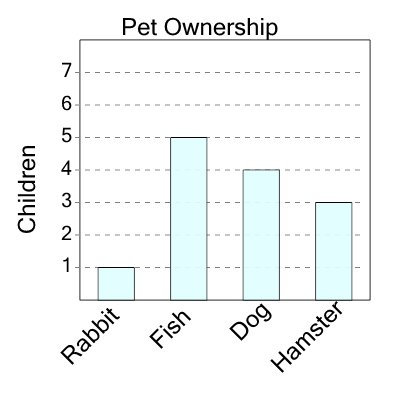
| How many kids have either a dog or a hamster as a pet? |
a
| 11 |
b
| 7 |
c
| 9 |
d
| 1 |
e
| 3 |
f
| 14 |
2

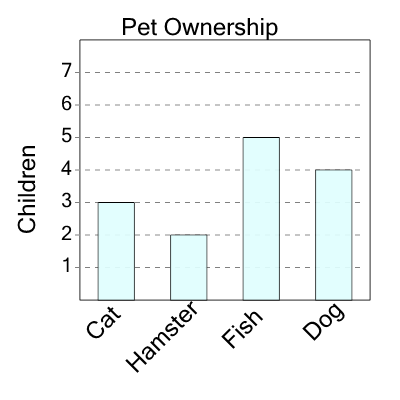
| How many kids have either a cat or a fish as a pet? |
a
| 5 |
b
| 0 |
c
| 6 |
d
| 3 |
3
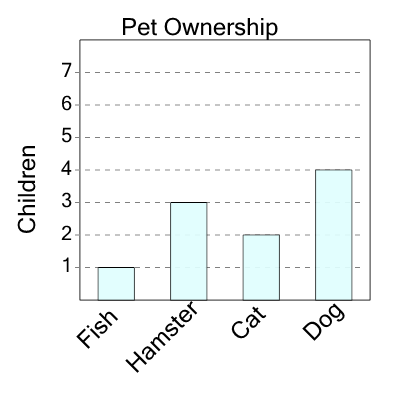
| How many kids have either a fish or a dog as a pet? |
a
| 11 |
b
| 5 |
c
| 9 |
d
| 14 |
e
| 3 |
f
| 1 |
4
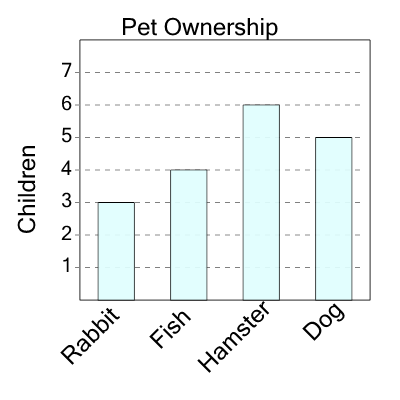
| How many kids have either a dog or a cat as a pet? |
a
| 8 |
b
| 1 |
c
| 6 |
d
| 3 |
e
| 11 |
f
| 2 |
5

| How many kids have either a fish or a cat as a pet? |
a
| 15 |
b
| 4 |
c
| 7 |
d
| 1 |
e
| 9 |
f
| 6 |
6
| How many kids have either a dog or a rabbit as a pet? |
a
| 11 |
b
| 2 |
c
| 15 |
d
| 13 |
e
| 4 |
f
| 8 |
7
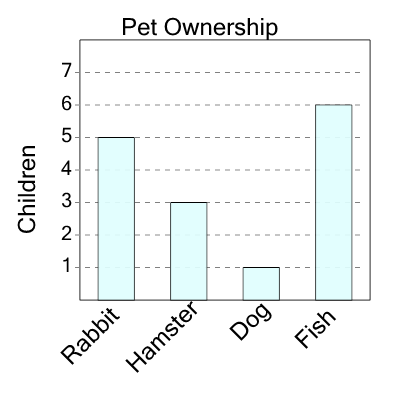
| How many kids have either a fish or a dog as a pet? |
a
| 7 |
b
| 11 |
c
| 1 |
d
| 0 |
e
| 9 |
f
| 4 |