Bar Graph (Single) - Sum of Two (Level 3)
This math topic focuses on interpreting and summarizing data using single bar graphs. The problems ask students to calculate the sum of quantities on specified days or locations depicted in the bar graphs. For example, students find sums of pizzas made on various combined days and millimeters of rain in different cities. Each question provides multiple choice answers, testing students' ability to read and extract relevant data from the bar charts. Overall, this topic helps sharpen analytical and data interpretation skills by combining information from graphical representations.
Work on practice problems directly here, or download the printable pdf worksheet to practice offline.
moreGraphing - Bar Graph (Single) - Sum of Two Worksheet
| Math worksheet on 'Graphing - Bar Graph (Single) - Sum of Two (Level 3)'. Part of a broader unit on 'Data and Graphs - Practice' Learn online: app.mobius.academy/math/units/data_graphing_practice/ |
1

| How many pizzas were made on Wednesday and Friday combined? |
a
| 10 |
b
| 110 |
c
| 90 |
d
| 120 |
e
| 20 |
f
| 50 |
2
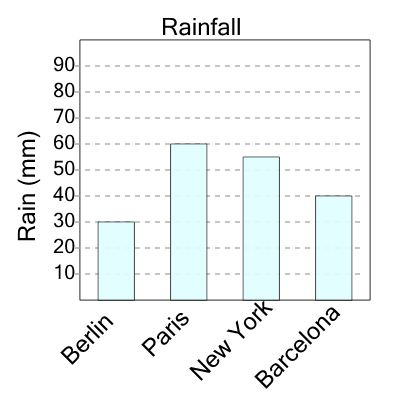
| How many millimeters of rain were there in New York and Berlin total? |
a
| 55 |
b
| 115 |
c
| 60 |
d
| 85 |
e
| 50 |
f
| 110 |
3
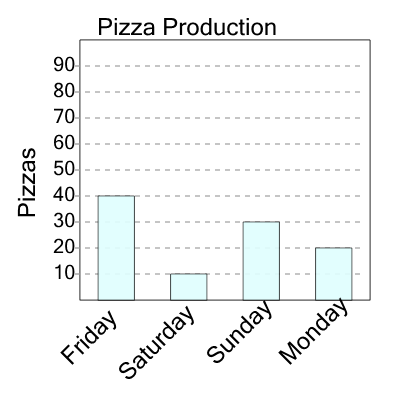
| How many pizzas were made on Friday and Sunday combined? |
a
| 70 |
b
| 130 |
c
| 100 |
d
| 50 |
e
| 10 |
4
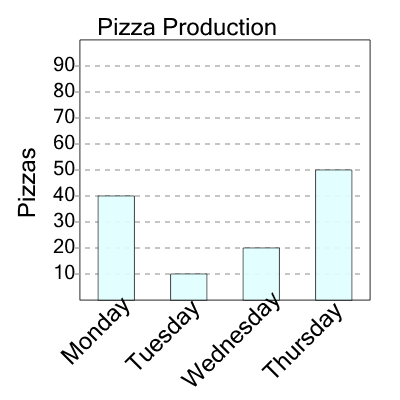
| How many pizzas were made on Monday and Tuesday combined? |
a
| 20 |
b
| 100 |
c
| 50 |
d
| 90 |
e
| 10 |
f
| 30 |
5

| How many pizzas were made on Saturday and Tuesday combined? |
a
| 50 |
b
| 30 |
c
| 70 |
d
| 100 |
6

| How many millimeters of rain were there in London and Paris total? |
a
| 105 |
b
| 115 |
c
| 140 |
d
| 120 |
e
| 90 |
f
| 75 |
7

| How many pizzas were made on Monday and Saturday combined? |
a
| 80 |
b
| 90 |
c
| 20 |
d
| 30 |
e
| 0 |
f
| 50 |