Bar Graph (Single) - Total of Series (Level 3)
This math topic focuses on practicing how to interpret single bar graphs and compute the total of a series. It contains questions that ask for the total amount of rain measured and the total number of pizzas made by interpreting different bar graphs. Each question offers multiple choice answers, testing a student's ability to analyze and sum data presented in graphical form. The overall subject falls under a broader unit about handling data and creating graphs.
Work on practice problems directly here, or download the printable pdf worksheet to practice offline.
moreGraphing - Bar Graph (Single) - Total of Series Worksheet
| Math worksheet on 'Graphing - Bar Graph (Single) - Total of Series (Level 3)'. Part of a broader unit on 'Data and Graphs - Practice' Learn online: app.mobius.academy/math/units/data_graphing_practice/ |
1
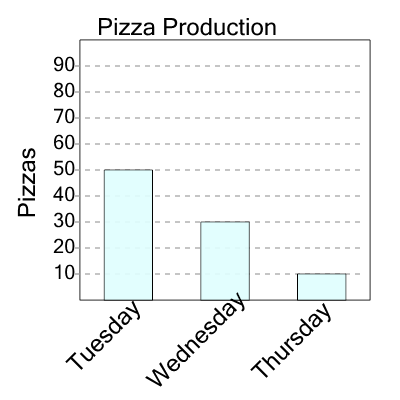
| How many pizzas were made in total? |
a
| 10 |
b
| 50 |
c
| 90 |
d
| 30 |
e
| 130 |
f
| 140 |
2
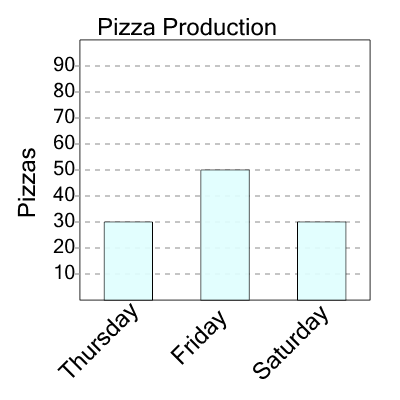
| How many pizzas were made in total? |
a
| 110 |
b
| 160 |
c
| 170 |
d
| 70 |
e
| 60 |
f
| 130 |
3
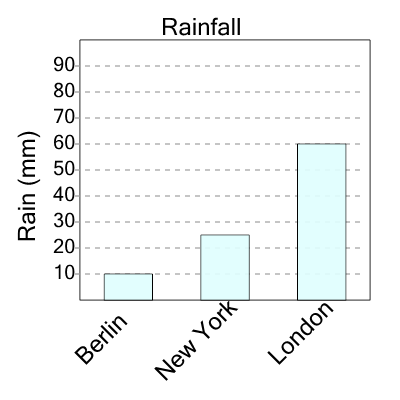
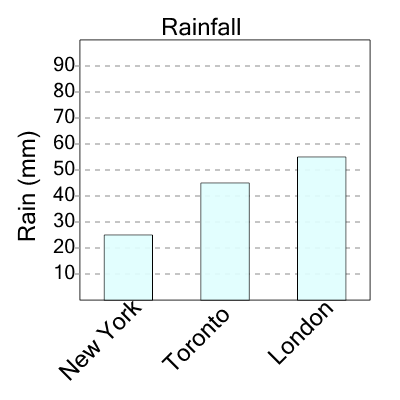
| What was the total amount of rain measured? |
a
| 70 |
b
| 130 |
c
| 55 |
d
| 95 |
e
| 80 |
4
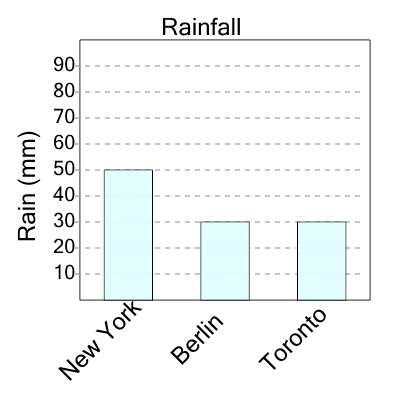
| What was the total amount of rain measured? |
a
| 85 |
b
| 110 |
c
| 135 |
d
| 80 |
e
| 70 |
5
| What was the total amount of rain measured? |
a
| 115 |
b
| 160 |
c
| 125 |
d
| 140 |
6
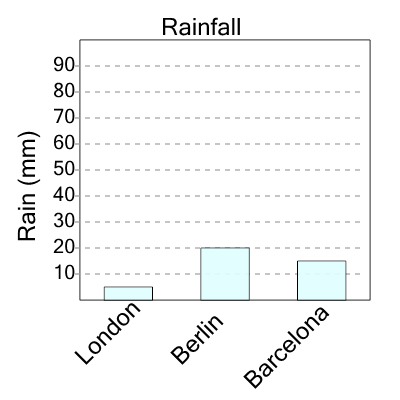
| What was the total amount of rain measured? |
a
| 0 |
b
| 40 |
c
| 30 |
d
| 70 |
e
| 25 |
f
| 50 |
7
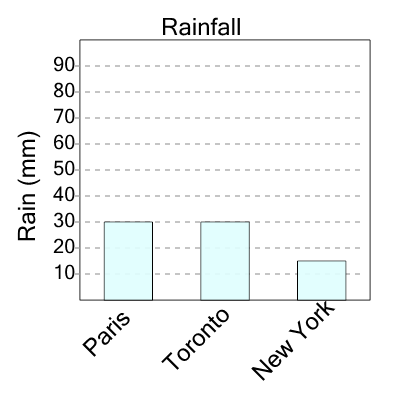
| What was the total amount of rain measured? |
a
| 50 |
b
| 75 |
c
| 85 |
d
| 45 |
e
| 40 |
f
| 65 |