Pictogram (Multiples) - Average of Series (Level 1)
This math topic focuses on interpreting pictograms and calculating averages from visual data. The problems involve determining the average number of hamburgers, pizzas, free throws, ice creams, and touchdowns per day or per player, with each image representing a multiple of five. Each question provides a pictogram and multiple-choice answers, emphasizing skills in both graphical data interpretation and statistical calculations in an advanced context within the subject of Data and Graphs.
Work on practice problems directly here, or download the printable pdf worksheet to practice offline.
moreGraphing - Pictogram (Multiples) - Average of Series Worksheet
| Math worksheet on 'Graphing - Pictogram (Multiples) - Average of Series (Level 1)'. Part of a broader unit on 'Data and Graphs - Advanced' Learn online: app.mobius.academy/math/units/data_graphing_advanced/ |
1
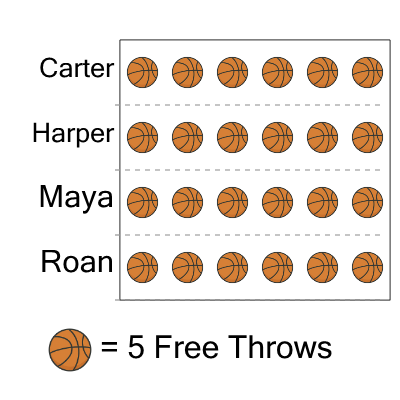
| What is the average number of free throws made per player? (each picture is 5) |
a
| 35 |
b
| 25 |
c
| 30 |
d
| 29 |
e
| 34 |
f
| 27 |
2

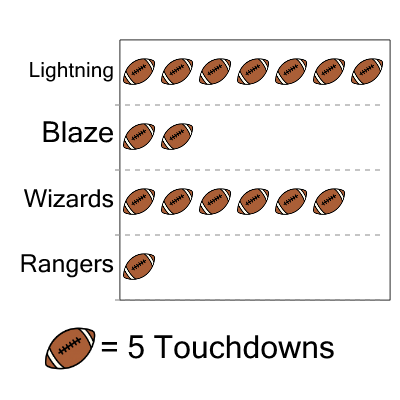
| What is the average number of touchdowns made per team? (each picture is 5) |
a
| 31 |
b
| 28 |
c
| 24 |
d
| 30 |
e
| 37 |
f
| 26 |
3

| What is the average number of touchdowns made per team? (each picture is 5) |
a
| 26 |
b
| 21 |
c
| 15 |
d
| 27 |
e
| 20 |
f
| 19 |
4

| What is the average number of free throws made per player? (each picture is 5) |
a
| 15 |
b
| 9 |
c
| 12 |
d
| 8 |
e
| 19 |
f
| 13 |
5

| What is the average number of pizzas produced each day? (each picture is 5) |
a
| 20 |
b
| 40 |
c
| 50 |
d
| 10 |
e
| 30 |
6

| What is the average number of free throws made per player? (each picture is 5) |
a
| 28 |
b
| 32 |
c
| 18 |
d
| 23 |
e
| 17 |
f
| 25 |
7
| What is the average number of touchdowns made per team? (each picture is 5) |
a
| 19 |
b
| 13 |
c
| 18 |
d
| 25 |
e
| 26 |
f
| 20 |