Pictogram (Multiples) - Sum of Two (Level 1)
This math topic focuses on interpreting and analyzing data using pictograms. Each symbol in a pictogram represents multiple units, and students are tasked with calculating the sum of such units for different paired items or categories. The skills practiced include understanding and interpreting pictograms, doing multiplicative arithmetic to determine total counts, and comparing data across categories. Problems involve contexts like counting touchdowns, ice creams, hamburgers, and pizzas based on given representations.
Work on practice problems directly here, or download the printable pdf worksheet to practice offline.
moreGraphing - Pictogram (Multiples) - Sum of Two Worksheet
| Math worksheet on 'Graphing - Pictogram (Multiples) - Sum of Two (Level 1)'. Part of a broader unit on 'Data and Graphs - Intro' Learn online: app.mobius.academy/math/units/data_graphing_intro/ |
1

| How many total touchdowns did phantoms and blaze make? (each picture is 5) |
a
| 38 |
b
| 45 |
c
| 40 |
d
| 37 |
e
| 52 |
f
| 49 |
2
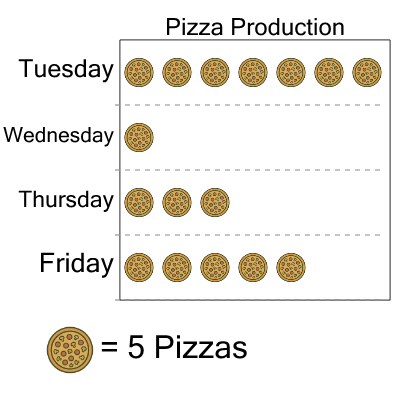
| How many pizzas were made on Tuesday and Thursday combined? (each picture is 5) |
a
| 20 |
b
| 50 |
c
| 100 |
d
| 70 |
e
| 30 |
f
| 110 |
3

| How many total icecreams did evan and carter eat? (each picture is 5) |
a
| 25 |
b
| 27 |
c
| 30 |
d
| 35 |
e
| 26 |
f
| 28 |
4
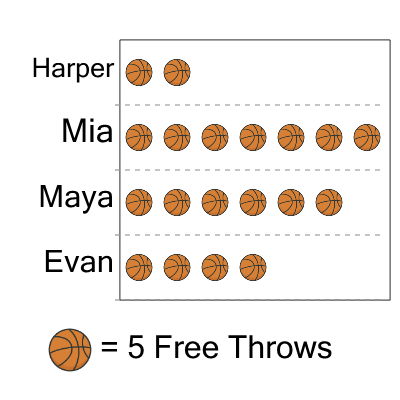
| How many total free throws did mia and maya make? (each picture is 5) |
a
| 61 |
b
| 59 |
c
| 72 |
d
| 63 |
e
| 68 |
f
| 65 |
5

| How many total icecreams did harper and carter eat? (each picture is 5) |
a
| 40 |
b
| 32 |
c
| 41 |
d
| 37 |
e
| 35 |
f
| 42 |
6
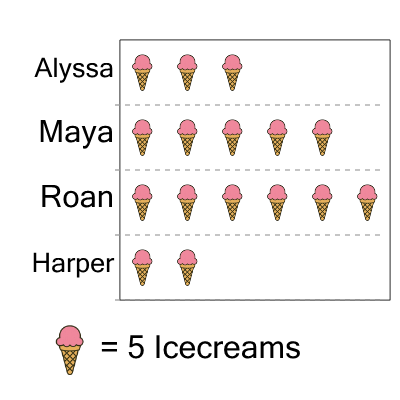
| How many total icecreams did roan and alyssa eat? (each picture is 5) |
a
| 40 |
b
| 43 |
c
| 49 |
d
| 47 |
e
| 38 |
f
| 45 |
7

| How many total hamburgers were sold on sunday and saturday? (each picture is 5) |
a
| 38 |
b
| 52 |
c
| 45 |
d
| 47 |
e
| 51 |
f
| 37 |