Pictogram (Multiples) - Total of Series (Level 1)
This math topic focuses on interpreting and calculating totals from pictorial representations (pictograms), where each picture symbolizes a multiple of a quantity (in this case, each picture equals 5). The exercises challenge students to total various items depicted in the images, enhancing skills in multiplication, addition, and data interpretation. The items counted include ice creams, free throws, pizzas, and touchdowns, providing a fun and engaging context for applying these mathematical concepts.
Work on practice problems directly here, or download the printable pdf worksheet to practice offline.
moreGraphing - Pictogram (Multiples) - Total of Series Worksheet
| Math worksheet on 'Graphing - Pictogram (Multiples) - Total of Series (Level 1)'. Part of a broader unit on 'Data and Graphs - Intro' Learn online: app.mobius.academy/math/units/data_graphing_intro/ |
1
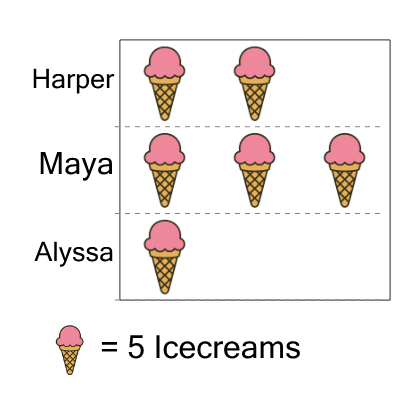
| How many icecreams in total were eaten? (each picture is 5) |
a
| 22 |
b
| 36 |
c
| 37 |
d
| 30 |
e
| 25 |
f
| 28 |
2

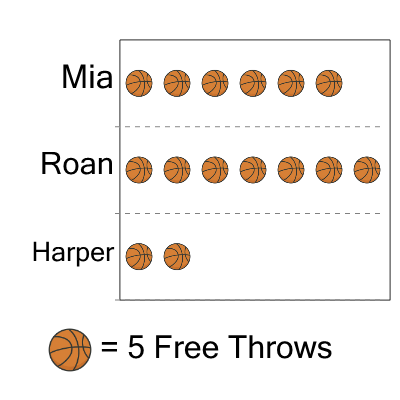
| How many free throws in total were made? (each picture is 5) |
a
| 70 |
b
| 68 |
c
| 60 |
d
| 62 |
e
| 65 |
3
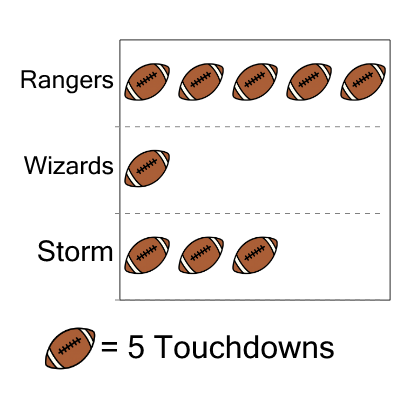
| How many touchdowns in total were made? (each picture is 5) |
a
| 37 |
b
| 51 |
c
| 50 |
d
| 40 |
e
| 45 |
f
| 48 |
4

| How many touchdowns in total were made? (each picture is 5) |
a
| 44 |
b
| 36 |
c
| 34 |
d
| 43 |
e
| 35 |
f
| 40 |
5

| How many touchdowns in total were made? (each picture is 5) |
a
| 53 |
b
| 42 |
c
| 52 |
d
| 50 |
e
| 43 |
f
| 45 |
6

| How many icecreams in total were eaten? (each picture is 5) |
a
| 78 |
b
| 72 |
c
| 67 |
d
| 82 |
e
| 79 |
f
| 75 |
7
| How many free throws in total were made? (each picture is 5) |
a
| 75 |
b
| 77 |
c
| 67 |
d
| 80 |