Pictogram (Ones) - Average of Series (Level 1)
This math topic focuses on advanced data handling skills such as calculating averages from data presented in pictograms. Learners practice determining the average number of specific items or actions across different scenarios (e.g., average ice creams eaten per kid, hamburgers sold per day, touchdowns made per team). The problems are presented visually and provide multiple-choice answers, enabling users to apply and assess their understanding of interpreting graphical data and performing arithmetic operations to find averages.
Work on practice problems directly here, or download the printable pdf worksheet to practice offline.
moreGraphing - Pictogram (Ones) - Average of Series Worksheet
| Math worksheet on 'Graphing - Pictogram (Ones) - Average of Series (Level 1)'. Part of a broader unit on 'Data and Graphs - Advanced' Learn online: app.mobius.academy/math/units/data_graphing_advanced/ |
1

| What is the average number of pizzas produced each day? |
a
| 45 |
b
| 35 |
c
| 15 |
d
| 5 |
e
| 55 |
2

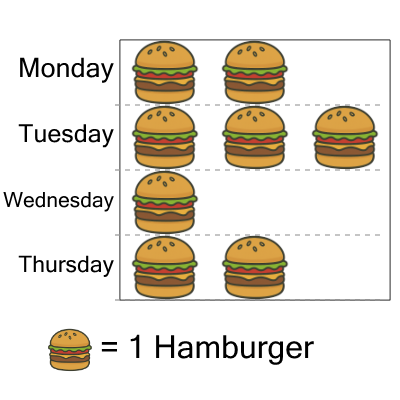
| What is the average number of hamburgers sold per day? |
a
| 5 |
b
| 2 |
c
| 7 |
d
| 11 |
e
| 9 |
f
| 3 |
3

| What is the average number of hamburgers sold per day? |
a
| 8 |
b
| 0 |
c
| 9 |
d
| 1 |
e
| 6 |
f
| 4 |
4

| What is the average number of pizzas produced each day? |
a
| 4 |
b
| 26 |
c
| 16 |
d
| 46 |
e
| 64 |
f
| 36 |
5
| What is the average number of hamburgers sold per day? |
a
| 0 |
b
| 3 |
c
| 2 |
d
| 6 |
e
| 1 |
6

| What is the average number of free throws made per player? |
a
| 3 |
b
| 7 |
c
| 10 |
d
| 1 |
e
| 4 |
f
| 5 |
7

| What is the average number of pizzas produced each day? |
a
| 4 |
b
| 34 |
c
| 46 |
d
| 66 |
e
| 44 |
f
| 14 |