Pictogram (Ones) - Difference of Two (Level 1)
This math topic helps learners develop skills in reading and interpreting data from pictograms (also known as pictographs), specifically focusing on calculating the difference in quantities represented in the graphs. Each question requires students to identify the difference between two sets of data depicted visually in a pictogram, using a scale where each symbol represents one unit. This activity is an introduction to working with data and graphs, teaching students how to analyze and compare quantitative information in a visual format.
Work on practice problems directly here, or download the printable pdf worksheet to practice offline.
moreGraphing - Pictogram (Ones) - Difference of Two Worksheet
| Math worksheet on 'Graphing - Pictogram (Ones) - Difference of Two (Level 1)'. Part of a broader unit on 'Data and Graphs - Intro' Learn online: app.mobius.academy/math/units/data_graphing_intro/ |
1

| How many more icecreams did Alyssa eat than Mia? |
a
| 0 |
b
| 7 |
c
| 5 |
d
| 8 |
e
| 4 |
2
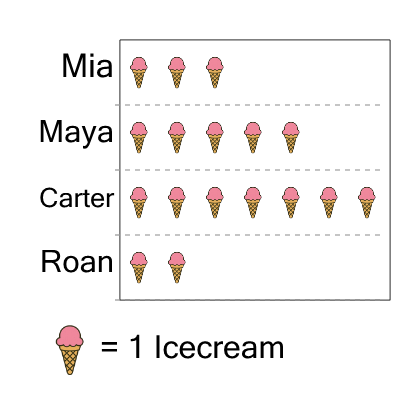
| How many more icecreams did Mia eat than Roan? |
a
| 2 |
b
| 1 |
c
| 8 |
d
| 6 |
e
| 7 |
f
| 3 |
3

| How many more free throws did Harper make than Alyssa? |
a
| 1 |
b
| 2 |
c
| 3 |
d
| 5 |
e
| 6 |
4

| How many more hamburgers were sold on Friday than on Tuesday? |
a
| 6 |
b
| 4 |
c
| 7 |
d
| 2 |
e
| 5 |
f
| 1 |
5

| How many more icecreams did Evan eat than Harper? |
a
| 4 |
b
| 3 |
c
| 6 |
d
| 10 |
e
| 7 |
f
| 8 |
6

| How many more hamburgers were sold on Friday than on Wednesday? |
a
| 0 |
b
| 2 |
c
| 1 |
d
| 7 |
e
| 6 |
f
| 4 |
7

| How many more hamburgers were sold on Friday than on Thursday? |
a
| 8 |
b
| 4 |
c
| 3 |
d
| 5 |
e
| 7 |
f
| 2 |