Pictogram (Ones) - Minimum (Level 1)
The math topic on this sheet focuses on interpreting data from pictograms to identify minimum values. Learners practice identifying the fewest occurrences in various scenarios, such as the least number of free throws made by individuals, the fewest touchdowns made by teams, and the fewest pizzas made on particular days. The emphasis is on interpreting simple pictograms, where each icon represents one unit. This basic data interpretation helps build skills in understanding and analyzing graphical data representations.
Work on practice problems directly here, or download the printable pdf worksheet to practice offline.
moreGraphing - Pictogram (Ones) - Minimum Worksheet
| Math worksheet on 'Graphing - Pictogram (Ones) - Minimum (Level 1)'. Part of a broader unit on 'Data and Graphs - Intro' Learn online: app.mobius.academy/math/units/data_graphing_intro/ |
1

| Who ate the fewest icecreams? |
a
| Alyssa |
b
| Harper |
c
| Evan |
d
| Roan |
2
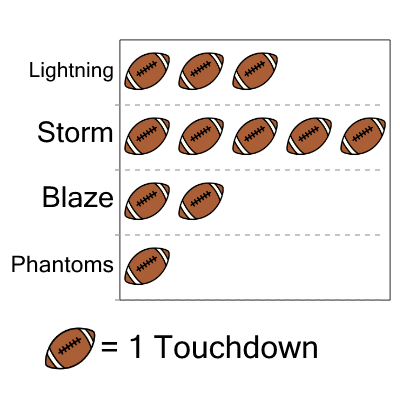
| Which team made the fewest touchdowns? |
a
| Blaze |
b
| Phantoms |
c
| Lightning |
d
| Storm |
3

| Who ate the fewest icecreams? |
a
| Maya |
b
| Harper |
c
| Roan |
d
| Carter |
4

| Who ate the fewest icecreams? |
a
| Carter |
b
| Mia |
c
| Maya |
d
| Alyssa |
5

| On what day were the smallest number of hamburgers sold? |
a
| Friday |
b
| Sunday |
c
| Monday |
d
| Saturday |
6

| Which team made the fewest touchdowns? |
a
| Phantoms |
b
| Blaze |
c
| Knights |
7
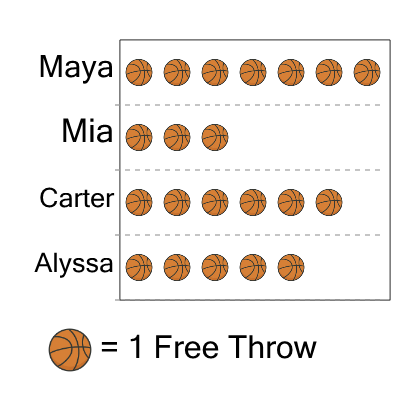
| Who made the fewest free throws? |
a
| Alyssa |
b
| Mia |
c
| Maya |
d
| Carter |