Pictogram (Ones) - Read Category (Level 1)
This topic centers on interpreting pictograms to answer questions related to different categories, such as sales, sporting events, and product outputs. The problems involve reading pictograms to determine specifics like the number of items sold on particular days, or performances such as the number of free throws made by individuals. The questions are typically presented in a multiple-choice format, enhancing skills in both graph reading and data interpretation within a primary introduction to data and graphs.
Work on practice problems directly here, or download the printable pdf worksheet to practice offline.
moreGraphing - Pictogram (Ones) - Read Category Worksheet
| Math worksheet on 'Graphing - Pictogram (Ones) - Read Category (Level 1)'. Part of a broader unit on 'Data and Graphs - Intro' Learn online: app.mobius.academy/math/units/data_graphing_intro/ |
1

| On what day were 3 pizzas made? |
a
| Tuesday |
b
| Sunday |
c
| Monday |
d
| Wednesday |
2

| Who ate 5 icecreams? |
a
| Evan |
b
| Maya |
c
| Mia |
d
| Alyssa |
3

| On what day were 3 pizzas made? |
a
| Saturday |
b
| Monday |
c
| Sunday |
4
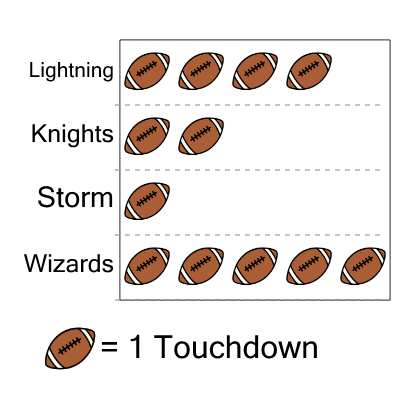
| Which team made 4 touchdowns? |
a
| Storm |
b
| Wizards |
c
| Lightning |
5
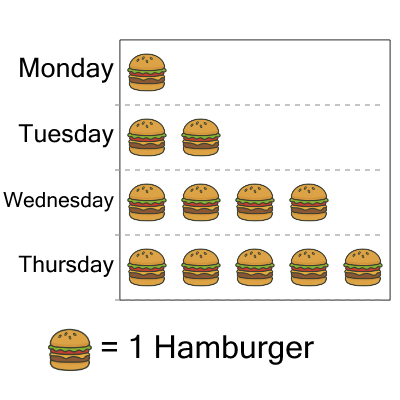
| What day were 2 hamburgers sold on? |
a
| Tuesday |
b
| Wednesday |
c
| Monday |
6

| What day were 7 hamburgers sold on? |
a
| Tuesday |
b
| Monday |
c
| Thursday |
d
| Wednesday |
7

| Who made 6 free throws? |
a
| Maya |
b
| Carter |
c
| Alyssa |
d
| Roan |