Pictogram (Ones) - Read Value (Level 1)
This topic focuses on interpreting basic pictogram charts to read and analyze values associated with everyday data, such as free throws made, ice creams eaten, touchdowns scored, and pizzas made on specific days. Each question presents a scenario with a corresponding pictogram and multiple-choice answers. The questions are designed to build students' skills in reading and extracting data from pictograms, reinforcing their understanding of foundational graphing concepts within the broader topic of introductory data and graphs.
Work on practice problems directly here, or download the printable pdf worksheet to practice offline.
moreGraphing - Pictogram (Ones) - Read Value Worksheet
| Math worksheet on 'Graphing - Pictogram (Ones) - Read Value (Level 1)'. Part of a broader unit on 'Data and Graphs - Intro' Learn online: app.mobius.academy/math/units/data_graphing_intro/ |
1

| How many hamburgers were sold on Monday? |
a
| 5 |
b
| 7 |
c
| 4 |
d
| 3 |
e
| 6 |
f
| 1 |
2

| How many pizzas were made on Friday? |
a
| 45 |
b
| 5 |
c
| 55 |
d
| 65 |
e
| 15 |
3

| How many touchdowns did Blaze make? |
a
| 4 |
b
| 6 |
c
| 2 |
d
| 12 |
e
| 1 |
f
| 7 |
4

| How many touchdowns did Storm make? |
a
| 6 |
b
| 5 |
c
| 3 |
d
| 7 |
e
| 1 |
5

| How many pizzas were made on Wednesday? |
a
| 46 |
b
| 76 |
c
| 4 |
d
| 36 |
e
| 44 |
f
| 56 |
6
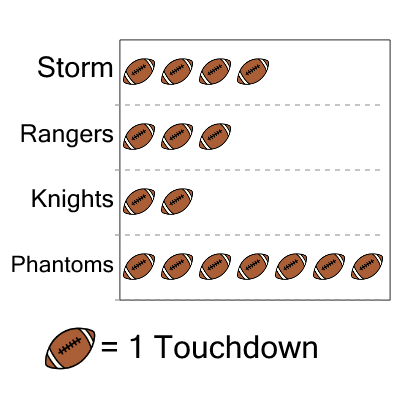
| How many touchdowns did Rangers make? |
a
| 5 |
b
| 3 |
c
| 8 |
d
| 1 |
e
| 7 |
7

| How many pizzas were made on Sunday? |
a
| 16 |
b
| 36 |
c
| 6 |
d
| 64 |
e
| 34 |
f
| 44 |