Pictogram (Ones) - Sum of Two (Level 1)
This math topic focuses on interpreting pictogram graphs to solve basic addition problems. It involves analyzing data visually presented in pictograms and extracting specific values to compute sums. The questions typically ask for the total of two items or categories from the graph, such as the combined number of pizzas sold on two different days, total touchdowns by two teams, or total items consumed by individuals over multiple days. This topic is designed to develop early data interpretation and addition skills, fitting into an introductory curriculum on data and graphs.
Work on practice problems directly here, or download the printable pdf worksheet to practice offline.
moreGraphing - Pictogram (Ones) - Sum of Two Worksheet
| Math worksheet on 'Graphing - Pictogram (Ones) - Sum of Two (Level 1)'. Part of a broader unit on 'Data and Graphs - Intro' Learn online: app.mobius.academy/math/units/data_graphing_intro/ |
1
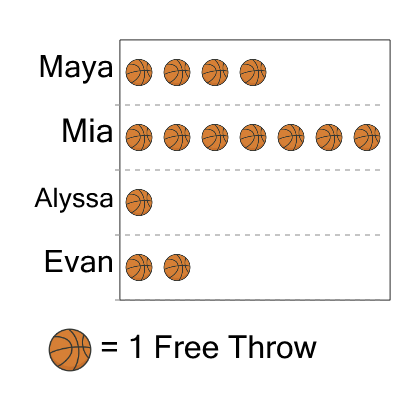
| How many total free throws did mia and maya make? |
a
| 11 |
b
| 17 |
c
| 5 |
d
| 3 |
e
| 7 |
f
| 6 |
2
| How many total free throws did maya and alyssa make? |
a
| 8 |
b
| 2 |
c
| 16 |
d
| 10 |
e
| 17 |
f
| 7 |
3
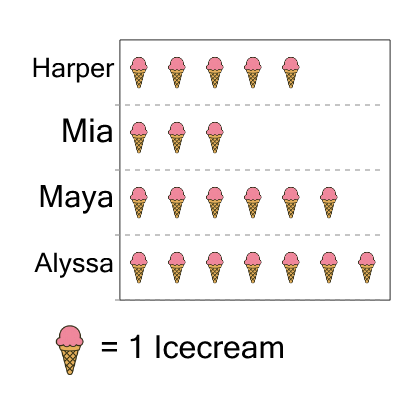
| How many total icecreams did alyssa and mia eat? |
a
| 17 |
b
| 2 |
c
| 10 |
d
| 7 |
e
| 13 |
f
| 3 |
4

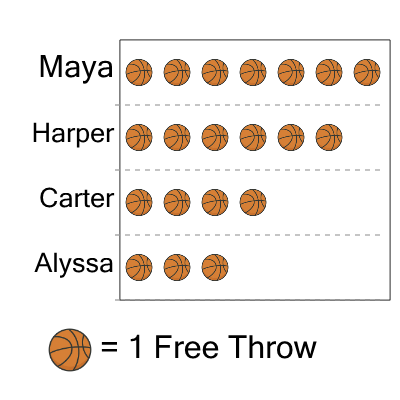
| How many total free throws did mia and maya make? |
a
| 6 |
b
| 1 |
c
| 12 |
d
| 2 |
e
| 9 |
5

| How many total free throws did evan and maya make? |
a
| 11 |
b
| 1 |
c
| 9 |
d
| 5 |
6

| How many pizzas were made on Wednesday and Tuesday combined? |
a
| 27 |
b
| 7 |
c
| 57 |
d
| 3 |
e
| 77 |
f
| 23 |
7

| How many total touchdowns did lightning and storm make? |
a
| 4 |
b
| 16 |
c
| 8 |
d
| 12 |
e
| 19 |
f
| 9 |