Pictogram (Ones) - Total of Series (Level 1)
This topic focuses on interpreting pictograms, which is an introductory concept in data representation and graphing. Students are tasked with analyzing given pictograms specific to different scenarios such as free throws, touchdowns, and ice cream consumption, and then determining the total counts from these charts. Each question lists multiple choice answers, enhancing skills in data analysis and total calculation based on visual information provided in pictorial form, typically representing data in units of one.
Work on practice problems directly here, or download the printable pdf worksheet to practice offline.
moreGraphing - Pictogram (Ones) - Total of Series Worksheet
| Math worksheet on 'Graphing - Pictogram (Ones) - Total of Series (Level 1)'. Part of a broader unit on 'Data and Graphs - Intro' Learn online: app.mobius.academy/math/units/data_graphing_intro/ |
1
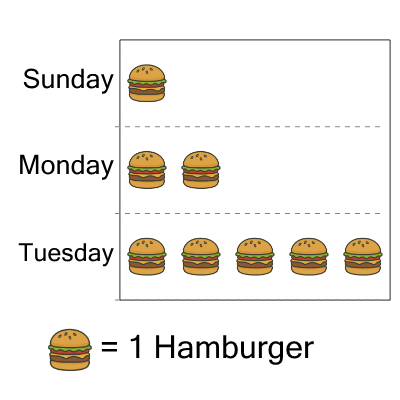
| How many hamburgers in total were sold? |
a
| 14 |
b
| 4 |
c
| 3 |
d
| 8 |
e
| 2 |
f
| 12 |
2

| How many hamburgers in total were sold? |
a
| 19 |
b
| 9 |
c
| 10 |
d
| 17 |
e
| 24 |
f
| 23 |
3

| How many free throws in total were made? |
a
| 14 |
b
| 19 |
c
| 10 |
d
| 11 |
e
| 16 |
f
| 9 |
4
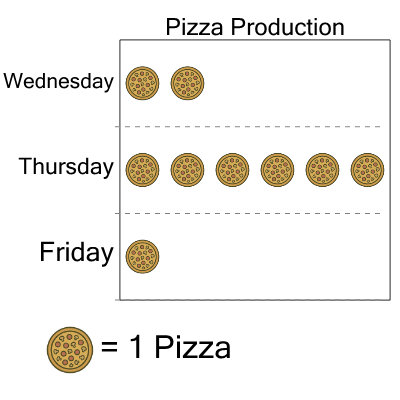
| How many pizzas were made in total? |
a
| 49 |
b
| 51 |
c
| 71 |
d
| 1 |
e
| 9 |
f
| 39 |
5
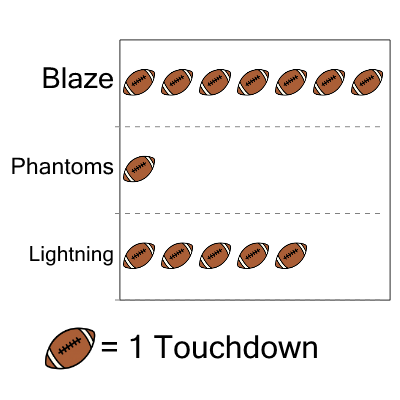
| How many touchdowns in total were made? |
a
| 20 |
b
| 17 |
c
| 16 |
d
| 13 |
e
| 15 |
f
| 9 |
6

| How many free throws in total were made? |
a
| 17 |
b
| 24 |
c
| 11 |
d
| 22 |
e
| 19 |
f
| 9 |
7

| How many pizzas were made in total? |
a
| 42 |
b
| 18 |
c
| 8 |
d
| 12 |
e
| 28 |
f
| 68 |