Tally Chart - Average of Series (Level 1)
This topic focuses on advanced data analysis and graph interpretation skills, particularly using tally charts and calculating averages. Students are tasked with determining the average numbers from various data sets related to kids owning different types of pets. Each problem provides a data set, and students need to compute the average number of kids for each type of pet. The problems gradually build analytical skills in deciphering visual data representations to solve mathematical problems related to averages.
Work on practice problems directly here, or download the printable pdf worksheet to practice offline.
moreGraphing - Tally Chart - Average of Series Worksheet
| Math worksheet on 'Graphing - Tally Chart - Average of Series (Level 1)'. Part of a broader unit on 'Data and Graphs - Advanced' Learn online: app.mobius.academy/math/units/data_graphing_advanced/ |
1

| What is the average number of kids who like each treat? |
a
| 9 |
b
| 2 |
c
| 13 |
d
| 7 |
e
| 3 |
f
| 8 |
2

| What is the average number of kids who like each food? |
a
| 7 |
b
| 5 |
c
| 12 |
d
| 10 |
e
| 3 |
f
| 6 |
3
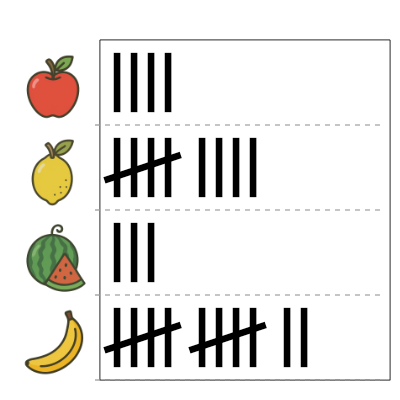
| What is the average number of kids who like each fruit? |
a
| 11 |
b
| 1 |
c
| 10 |
d
| 14 |
e
| 7 |
f
| 2 |
4

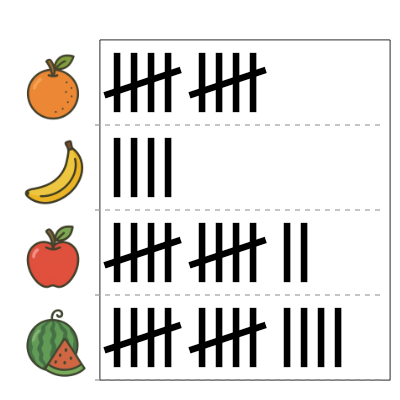
| What is the average number of kids who like each fruit? |
a
| 2 |
b
| 3 |
c
| 8 |
d
| 7 |
e
| 5 |
f
| 14 |
5

| What is the average number of kids who like each sport? |
a
| 15 |
b
| 12 |
c
| 11 |
d
| 13 |
e
| 18 |
f
| 5 |
6
| What is the average number of kids who like each fruit? |
a
| 10 |
b
| 14 |
c
| 15 |
d
| 9 |
e
| 16 |
f
| 2 |
7

| What is the average number of kids who like each fruit? |
a
| 2 |
b
| 10 |
c
| 7 |
d
| 9 |
e
| 14 |
f
| 12 |