Tally Chart - Difference of Two (Level 1)
This math topic focuses on introducing the basics of data interpretation and graph reading through tally charts. It involves comparing quantities to determine the difference between two sets of data. Specifically, the problems involve finding out how many more of one type of pet (like lizards, birds, cats, dogs, or fish) certain kids have compared to another type, by using visual information presented in tally charts. The ability to interpret these charts and perform simple subtraction to find the differences is essential for solving these problems.
Work on practice problems directly here, or download the printable pdf worksheet to practice offline.
moreGraphing - Tally Chart - Difference of Two Worksheet
| Math worksheet on 'Graphing - Tally Chart - Difference of Two (Level 1)'. Part of a broader unit on 'Data and Graphs - Intro' Learn online: app.mobius.academy/math/units/data_graphing_intro/ |
1

| How many more kids like donut than ice cream as a treat? |
a
| 1 |
b
| 6 |
c
| 2 |
d
| 3 |
e
| 5 |
2

| How many more kids like pizza than sandwich as a food? |
a
| 6 |
b
| 3 |
c
| 8 |
d
| 1 |
e
| 7 |
f
| 5 |
3

| How many more kids like train than plane as a transportation type? |
a
| 4 |
b
| 0 |
c
| 7 |
d
| 2 |
e
| 3 |
f
| 1 |
4

| How many more kids like soccer than cricket as a sport? |
a
| 3 |
b
| 4 |
c
| 10 |
d
| 1 |
e
| 7 |
f
| 9 |
5
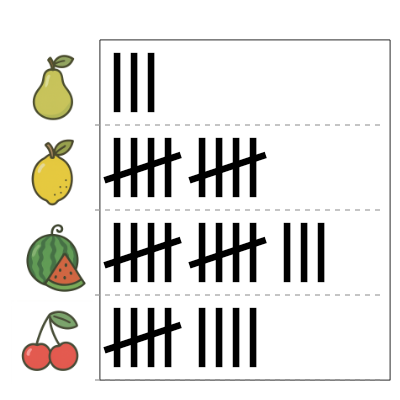
| How many more kids like watermelon than pear as a fruit? |
a
| 4 |
b
| 6 |
c
| 2 |
d
| 3 |
e
| 16 |
f
| 10 |
6

| How many more kids like candy than lollipop as a treat? |
a
| 16 |
b
| 8 |
c
| 10 |
d
| 11 |
e
| 9 |
f
| 7 |
7

| How many more kids like cherry than lemon as a fruit? |
a
| 2 |
b
| 11 |
c
| 4 |
d
| 3 |
e
| 10 |
f
| 8 |