Tally Chart - Read Category (Level 1)
This math topic focuses on understanding and interpreting data from tally charts. The problems engage learners in identifying the category, specifically different pets, that corresponds to a given number of entries charted on a tally. Each question provides a scenario asking learners to determine which pet is owned by a specific number of children, using visual aids like tally marks for each pet category. This practice helps enhance skills in reading and interpreting basic graph data, contributing to a foundational understanding of data representation and analysis.
Work on practice problems directly here, or download the printable pdf worksheet to practice offline.
moreGraphing - Tally Chart - Read Category Worksheet
| Math worksheet on 'Graphing - Tally Chart - Read Category (Level 1)'. Part of a broader unit on 'Data and Graphs - Intro' Learn online: app.mobius.academy/math/units/data_graphing_intro/ |
1

| What fruit do 6 children like? |
a
| Orange |
b
| Watermelon |
c
| Pear |
d
| Apple |
2

| What transportation type do 8 children like? |
a
| Ship |
b
| Bike |
c
| Train |
d
| Plane |
3

| What food do 4 children like? |
a
| Hamburger |
b
| Cake |
c
| Ice Cream |
d
| Sandwich |
4

| What pet do 13 children have? |
a
| Bird |
b
| Fish |
c
| Lizard |
d
| Cat |
5

| What transportation type do 5 children like? |
a
| Train |
b
| Bike |
c
| Car |
6

| What treat do 3 children like? |
a
| Cake |
b
| Donut |
c
| Candy |
7
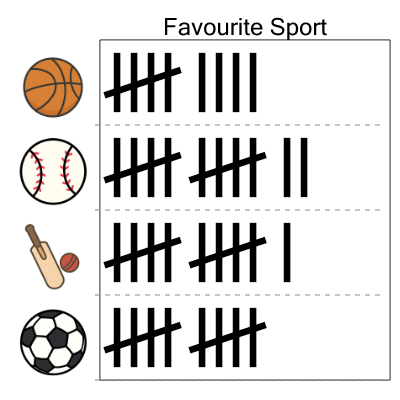
| What sport do 11 children like? |
a
| Baseball |
b
| Soccer |
c
| Basketball |
d
| Cricket |