Tally Chart - Read Value (Level 1)
This math topic focuses on developing the ability to read and interpret data from tally charts. Students are tasked with determining how many kids own different types of pets, like lizards, fish, birds, and cats, by analyzing the data presented in chart form. Each problem presents multiple choice answers, enhancing skills in graph reading and data interpretation within the context of an introductory unit on data and graphs. The problems are designed to test and improve students' accuracy and proficiency in extracting specific information from graphical data representations.
Work on practice problems directly here, or download the printable pdf worksheet to practice offline.
moreGraphing - Tally Chart - Read Value Worksheet
| Math worksheet on 'Graphing - Tally Chart - Read Value (Level 1)'. Part of a broader unit on 'Data and Graphs - Intro' Learn online: app.mobius.academy/math/units/data_graphing_intro/ |
1

| How many kids like lollipop as a treat? |
a
| 12 |
b
| 15 |
c
| 8 |
d
| 6 |
e
| 9 |
2
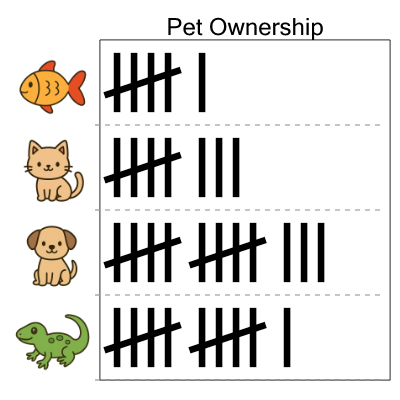
| How many kids have a fish as a pet? |
a
| 2 |
b
| 7 |
c
| 6 |
d
| 8 |
e
| 9 |
f
| 13 |
3
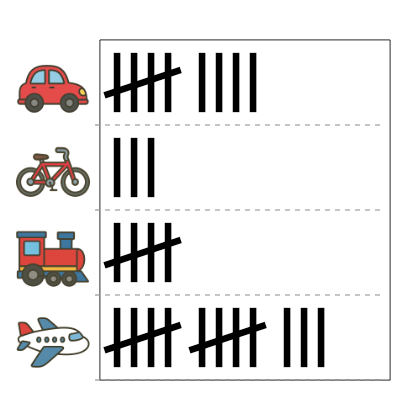
| How many kids like bike as a transportation type? |
a
| 1 |
b
| 10 |
c
| 7 |
d
| 5 |
e
| 2 |
f
| 3 |
4

| How many kids like soccer as a sport? |
a
| 10 |
b
| 12 |
c
| 13 |
d
| 14 |
e
| 4 |
f
| 6 |
5

| How many kids like car as a transportation type? |
a
| 5 |
b
| 6 |
c
| 9 |
d
| 15 |
e
| 10 |
f
| 11 |
6

| How many kids like cricket as a sport? |
a
| 9 |
b
| 8 |
c
| 2 |
d
| 4 |
e
| 5 |
f
| 7 |
7

| How many kids like cake as a food? |
a
| 10 |
b
| 4 |
c
| 9 |
d
| 11 |
e
| 0 |
f
| 8 |