Tally Chart - Total of Series (Level 1)
This topic focuses on practicing the interpretation of tally charts to determine the total number of surveyed children. The problems all pose a consistent question: "How many total children were surveyed?" Respondents must analyze provided tally chart images to ascertain the sum of counts represented in the tally marks. Each question offers multiple choice answers, fostering skills in reading tally charts and basic summation, part of an introductory unit on data and graphs.
Work on practice problems directly here, or download the printable pdf worksheet to practice offline.
moreGraphing - Tally Chart - Total of Series Worksheet
| Math worksheet on 'Graphing - Tally Chart - Total of Series (Level 1)'. Part of a broader unit on 'Data and Graphs - Intro' Learn online: app.mobius.academy/math/units/data_graphing_intro/ |
1
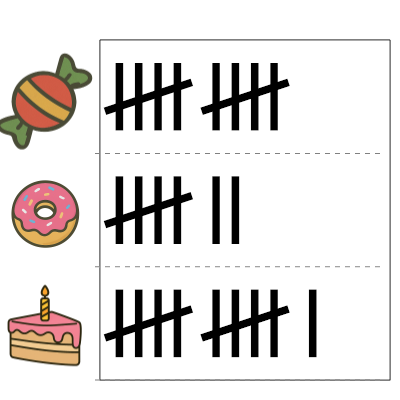
| How many total children were surveyed? |
a
| 26 |
b
| 20 |
c
| 21 |
d
| 28 |
e
| 33 |
f
| 22 |
2

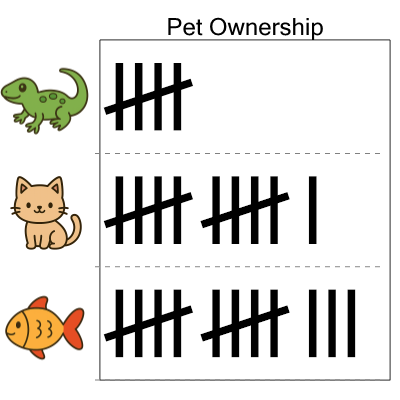
| How many total children were surveyed? |
a
| 22 |
b
| 23 |
c
| 34 |
d
| 27 |
e
| 32 |
3

| How many total children were surveyed? |
a
| 21 |
b
| 33 |
c
| 19 |
d
| 32 |
e
| 26 |
f
| 29 |
4
| How many total children were surveyed? |
a
| 29 |
b
| 26 |
c
| 22 |
d
| 21 |
e
| 27 |
f
| 35 |
5

| How many total children were surveyed? |
a
| 15 |
b
| 2 |
c
| 9 |
d
| 11 |
e
| 3 |
f
| 13 |
6

| How many total children were surveyed? |
a
| 19 |
b
| 14 |
c
| 17 |
d
| 9 |
e
| 13 |
f
| 11 |
7

| How many total children were surveyed? |
a
| 21 |
b
| 18 |
c
| 13 |
d
| 10 |
e
| 14 |
f
| 25 |