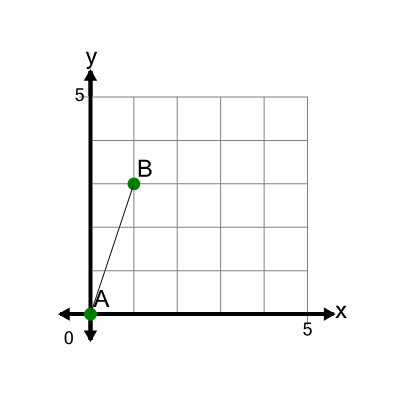
This math topic focuses on calculating the slope of a line between two points displayed on a graph. The questions involve various scenarios where learners identify the slope from graphical representations, with slope values presented as decimals. The problems are designed to aid in understanding and applying the concept of slope in the context of line equations and graphing, serving as an introductory exercise to broader units on these subjects.
Work on practice problems directly here, or download the printable pdf worksheet to practice offline.
moreSlope of a Line Between Two Points on Graph - Decimal Worksheet

| Math worksheet on 'Slope of a Line Between Two Points on Graph - Decimal (Level 1)'. Part of a broader unit on 'Line Equations and Graphing - Intro' Learn online: app.mobius.academy/math/units/line_equations_and_graphing_intro/ |
1

| Find the slope of the line between Point A and Point B |
a
| 4.2 |
b
| 2.5 |
c
| -0.5 |
d
| 3 |
e
| -1.8 |
f
| 0.33 |
2

| Find the slope of the line between Point A and Point B |
a
| -0.08 |
b
| -1.25 |
c
| 5 |
d
| -0.25 |
e
| 0.2 |
f
| -0.16 |
3

| Find the slope of the line between Point A and Point B |
a
| 1.25 |
b
| -0.5 |
c
| -1 |
d
| 1 |
e
| 3 |
f
| 0.8 |
4

| Find the slope of the line between Point A and Point B |
a
| 0.67 |
b
| -2 |
c
| 1.8 |
d
| 3.9 |
e
| 1.5 |
f
| -1.2 |
5

| Find the slope of the line between Point A and Point B |
a
| 0.4 |
b
| 0 |
c
| 4 |
d
| 0.15 |
e
| 0.5 |
f
| 0.25 |
6

| Find the slope of the line between Point A and Point B |
a
| 0.5 |
b
| -1.5 |
c
| 0 |
d
| 3 |
e
| 2.5 |
f
| 0.4 |
7

| Find the slope of the line between Point A and Point B |
a
| 1.1 |
b
| 0.8 |
c
| 2 |
d
| -0.1 |
e
| 1.4 |
f
| 0.5 |