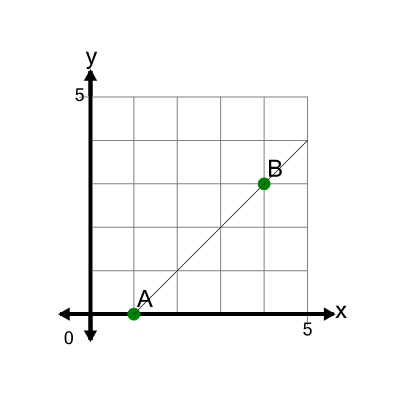
This math topic focuses on learning how to find the slope of a line from a graph that includes decimal points. It involves interpreting points plotted on a coordinate grid, calculating the difference in 'y' values (rise) over the difference in 'x' values (run), and selecting the correct slope from multiple choices offered for each question. This essential technique in understanding line equations and basic graphing supports foundational skills in algebra and coordinate geometry. The skills practiced here are part of an introductory unit on line equations and graphing.
Work on practice problems directly here, or download the printable pdf worksheet to practice offline.
moreSlope of a Line from Graph (with points) - Decimal Worksheet

| Math worksheet on 'Slope of a Line from Graph (with points) - Decimal (Level 1)'. Part of a broader unit on 'Line Equations and Graphing - Intro' Learn online: app.mobius.academy/math/units/line_equations_and_graphing_intro/ |
1

| Find the slope of the line between Point A and Point B |
a
| -0.6 |
b
| 1 |
c
| 2.2 |
d
| 0.75 |
e
| -1 |
f
| -1.25 |
2

| Find the slope of the line between Point A and Point B |
a
| 1 |
b
| -2 |
c
| 3 |
d
| -0.5 |
e
| 1.5 |
f
| 1.8 |
3

| Find the slope of the line between Point A and Point B |
a
| 0.33 |
b
| 0.13 |
c
| 0.73 |
d
| -0.5 |
e
| 3 |
f
| -0.07 |
4

| Find the slope of the line between Point A and Point B |
a
| 0.75 |
b
| 1.33 |
c
| 2.5 |
d
| 4 |
e
| -1.25 |
f
| 1.6 |
5

| Find the slope of the line between Point A and Point B |
a
| 2 |
b
| 0.64 |
c
| 1.25 |
d
| 0.8 |
e
| -0.48 |
f
| 1.28 |
6

| Find the slope of the line between Point A and Point B |
a
| 0.45 |
b
| 4 |
c
| 1 |
d
| 0.25 |
e
| 0.1 |
f
| 0.15 |
7

| Find the slope of the line between Point A and Point B |
a
| 2.8 |
b
| 2 |
c
| -1.25 |
d
| 0.25 |
e
| 5.6 |
f
| 4 |