Concept Intro (Sharing Food) - Description to Term (Level 1)
This math topic focuses on basic statistical concepts involving the mean, median, mode, and range, using a "Sharing Candy" scenario. Primarily, it challenges learners to identify the median, which represents the middle value in an ordered sequence, and the range, indicating the difference between the highest and lowest values. This helps students familiarize themselves with fundamental descriptive statistics terms within the broader context of Probability and Statistics.
Work on practice problems directly here, or download the printable pdf worksheet to practice offline.
moreStatistics - Concept Intro (Sharing Food) - Description to Term Worksheet

| Math worksheet on 'Statistics - Concept Intro (Sharing Food) - Description to Term (Level 1)'. Part of a broader unit on 'Probability and Statistics - Mean, Median, and Mode - Intro' Learn online: app.mobius.academy/math/units/probability_and_statistics_mean_median_mode_intro/ |
1

| What is the term for the DIFFERENCE between the largest and smallest number of oranges the kids have? |
a
| mean |
b
| median |
c
| mode |
d
| range |
2

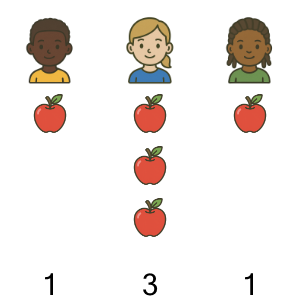
| What is the term for the number of apples that occurs most OFTEN? |
a
| mean |
b
| median |
c
| mode |
d
| range |
3

| What is the term for how many apples the MIDDLE kid would have if you arranged them from fewest to most? |
a
| mean |
b
| median |
c
| mode |
d
| range |
4

| What is the term for how many apples each kid would have if they SHARED evenly? |
a
| mean |
b
| median |
c
| mode |
d
| range |
5

| What is the term for how many candies the MIDDLE kid would have if you arranged them from fewest to most? |
a
| mean |
b
| median |
c
| mode |
d
| range |
6

| What is the term for the number of donuts that occurs most OFTEN? |
a
| mean |
b
| median |
c
| mode |
d
| range |
7

| What is the term for how many ice creams the MIDDLE kid would have if you arranged them from fewest to most? |
a
| mean |
b
| median |
c
| mode |
d
| range |