Mode - Pictures to Concept (Level 2)
This math topic focuses on identifying the mode from visual data sets. Students are tasked with examining images of varying counts of colored shapes (particularly white squares and blue circles) and determining the number most frequently occurring. The problems emphasize recognizing patterns and frequencies in sets, essential for understanding statistics and data analysis within a broader unit on mean, median, and mode. Each question provides multiple-choice options, helping students practice and reinforce their skills in interpreting statistical data visually.
Work on practice problems directly here, or download the printable pdf worksheet to practice offline.
moreStatistics - Mode - Pictures to Concept Worksheet
| Math worksheet on 'Statistics - Mode - Pictures to Concept (Level 2)'. Part of a broader unit on 'Probability and Statistics - Mean, Median, and Mode - Intro' Learn online: app.mobius.academy/math/units/probability_and_statistics_mean_median_mode_intro/ |
1
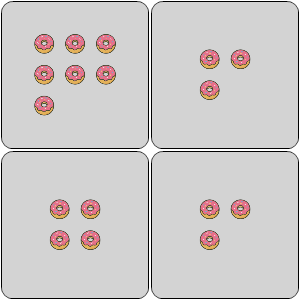
| What number of donuts occurs most OFTEN? |
a
| 1 |
b
| 7 |
c
| 2 |
d
| 3 |
e
| 6 |
f
| 0 |
2

| What number of squares occurs most OFTEN? |
a
| 3 |
b
| 5 |
c
| 4 |
d
| 2 |
e
| 1 |
f
| 8 |
3

| What number of oranges occurs most OFTEN? |
a
| 2 |
b
| 4 |
c
| 9 |
d
| 3 |
e
| 6 |
f
| 1 |
4

| What number of apples occurs most OFTEN? |
a
| 7 |
b
| 6 |
c
| 3 |
d
| 1 |
e
| 9 |
f
| 10 |
5

| What number of ice creams occurs most OFTEN? |
a
| 4 |
b
| 9 |
c
| 6 |
d
| 1 |
e
| 10 |
f
| 5 |
6

| What number of circles occurs most OFTEN? |
a
| 4 |
b
| 5 |
c
| 3 |
d
| 0 |
e
| 7 |
f
| 2 |
7

| What number of ice creams occurs most OFTEN? |
a
| 3 |
b
| 6 |
c
| 4 |
d
| 2 |
e
| 0 |
f
| 5 |