Mode - Pictures to Correct Term (Level 1)
This math topic focuses on understanding and identifying the mode from given groups of data. Students are presented with images depicting various quantities of blue circles and white squares grouped together, and they have to determine which number appears most frequently (i.e., the mode) in each scenario. The problems are designed to enhance students' skills in interpreting visual data and applying statistical concepts, specifically the calculation of mode in practical and visual contexts. This is set within a broader introductory curriculum on mean, median, and mode.
Work on practice problems directly here, or download the printable pdf worksheet to practice offline.
moreStatistics - Mode - Pictures to Correct Term Worksheet
| Math worksheet on 'Statistics - Mode - Pictures to Correct Term (Level 1)'. Part of a broader unit on 'Probability and Statistics - Mean, Median, and Mode - Intro' Learn online: app.mobius.academy/math/units/probability_and_statistics_mean_median_mode_intro/ |
1

| What is the MODE of the number of apples in each group? |
a
| 7 |
b
| 5 |
c
| 2 |
d
| 1 |
e
| 4 |
f
| 0 |
2

| What is the MODE of the number of squares in each group? |
a
| 12 |
b
| 9 |
c
| 6 |
d
| 8 |
e
| 4 |
f
| 7 |
3

| What is the MODE of the number of candies in each group? |
a
| 7 |
b
| 1 |
c
| 8 |
d
| 11 |
e
| 4 |
f
| 6 |
4

| What is the MODE of the number of oranges in each group? |
a
| 1 |
b
| 4 |
c
| 5 |
d
| 7 |
e
| 12 |
f
| 8 |
5

| What is the MODE of the number of apples in each group? |
a
| 9 |
b
| 5 |
c
| 8 |
d
| 2 |
e
| 3 |
f
| 1 |
6
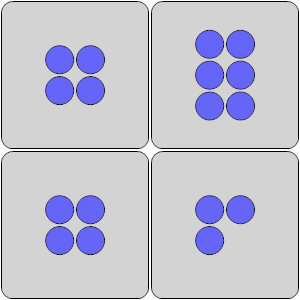
| What is the MODE of the number of circles in each group? |
a
| 1 |
b
| 6 |
c
| 0 |
d
| 9 |
e
| 2 |
f
| 4 |
7

| What is the MODE of the number of squares in each group? |
a
| 5 |
b
| 3 |
c
| 8 |
d
| 6 |
e
| 0 |
f
| 7 |